Kpi's in Supply Chain
Transform Operations, Enhance Productivity, and Drive Growth with Data-Driven Insights.
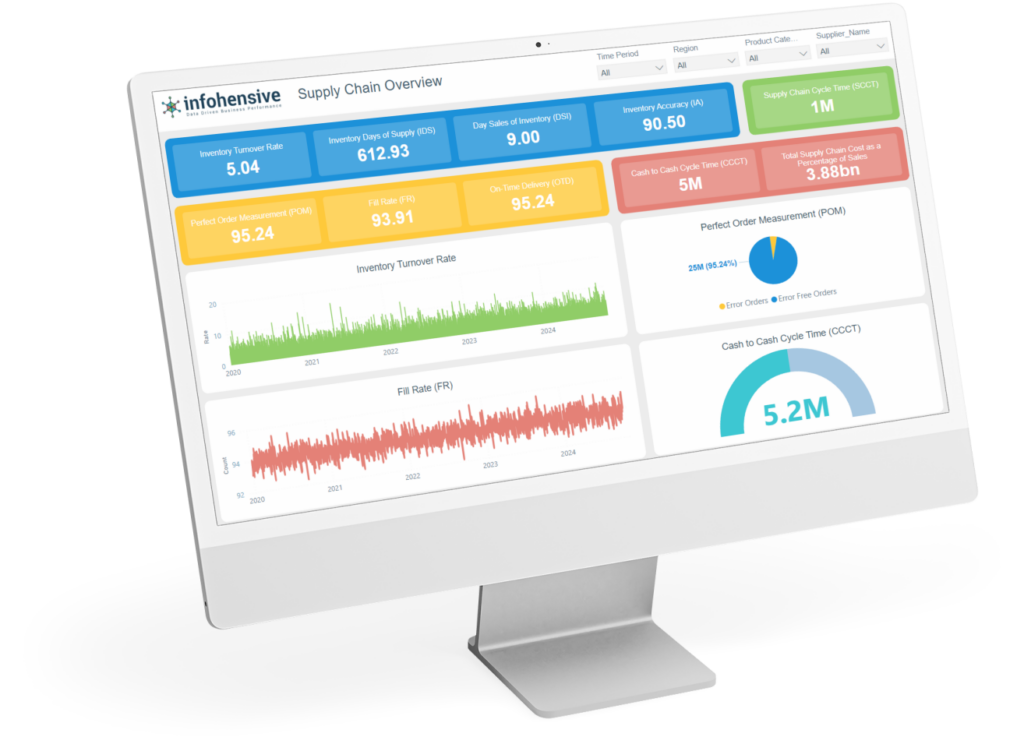
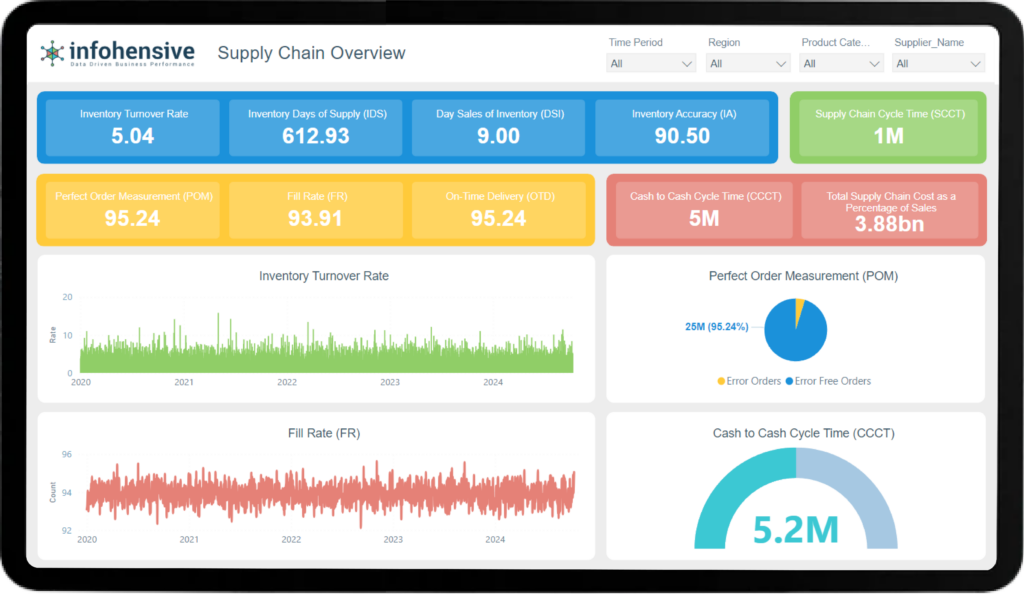
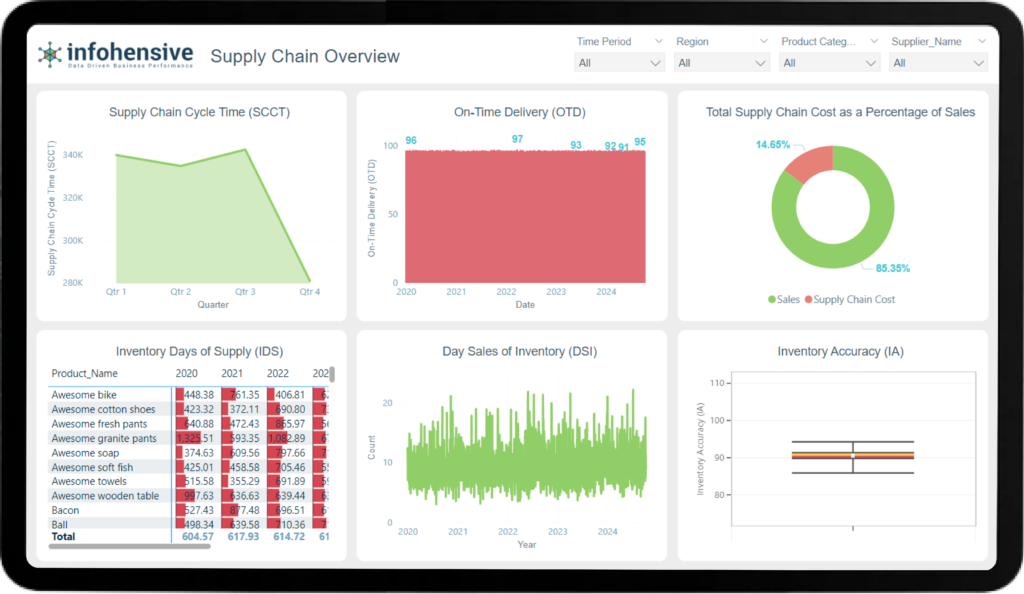
Business Question: How efficiently is inventory being managed?
Definition: Inventory turnover rate measures how many times inventory is sold and replaced over a period.
Description: ITR helps assess the efficiency of inventory management. A high ITR indicates faster inventory turnover, which can reduce holding costs and improve cash flow.
Formula: ITR=Cost of Goods SoldAverage Inventory{ITR} = \frac{{Cost of Goods Sold}}{{Average Inventory}}ITR=Average InventoryCost of Goods Sold
Calculation Example: In a month, if the cost of goods sold is $100,000 and average inventory is $50,000, ITR = 2.0.
Chart Type: Bar chart.
Color Scheme: Shades of green indicating efficiency.
Business Question: What percentage of orders are error-free?
Definition: POM measures the percentage of orders that are fulfilled without errors across various stages.
Description: POM includes metrics like order accuracy, on-time delivery, and complete shipments. A higher POM indicates better supply chain reliability and customer satisfaction.
Formula: POM=(Total Orders−Error OrdersTotal Orders)×100{POM} = \left( \frac{{Total Orders} - {Error Orders}}{{Total Orders}} \right) \times 100POM=(Total OrdersTotal Orders−Error Orders)×100
Calculation Example: Out of 500 orders, 480 were error-free. POM = (480/500) * 100 = 96%.
Chart Type: Pie chart.
Color Scheme: Blue and gray representing success rates.
Business Question: What percentage of customer orders are filled on the first shipment?
Definition: Fill rate measures the percentage of customer orders that are shipped complete in the initial shipment.
Description: FR indicates logistics efficiency and impacts customer satisfaction. A higher FR suggests effective inventory management and order fulfillment.
Formula: FR=(1−Total Items - Shipped ItemsTotal Items)×100{FR} = \left( 1 - \frac{{Total Items - Shipped Items}}{{Total Items}} \right) \times 100FR=(1−Total ItemsTotal Items - Shipped Items)×100
Calculation Example: 800 items were ordered, and 750 were shipped in the first shipment. FR = (1 - (50/800)) * 100 = 93.75%.
Chart Type: Line chart.
Color Scheme: Yellow and orange indicating fulfillment success.
Business Question: How long does it take to convert inventory investments into cash received from customers?
Definition: CCCT measures the number of days between paying suppliers and receiving payments from customers.
Description: CCCT helps assess liquidity and operational efficiency. A shorter CCCT indicates better cash flow management.
Formula: CCCT=(Receivable Days+Inventory Days)−Payable Days{CCCT} = ({Receivable Days} + {Inventory Days}) - {Payable Days}CCCT=(Receivable Days+Inventory Days)−Payable Days
Calculation Example: Receivable Days = 30, Inventory Days = 60, Payable Days = 45. CCCT = (30 + 60) - 45 = 45 days.
Chart Type: Gauge chart.
Color Scheme: Red to green gradient indicating financial health.
Business Question: How long does it take to fulfill an order when starting with zero inventory?
Definition: SCCT measures the total time from placing an order to delivering it to the customer, assuming no inventory is on hand.
Description: SCCT reflects supply chain efficiency and responsiveness. A shorter SCCT indicates faster order fulfillment.
Formula: SCCT=Time to Order and Receive Supplies+Order Fulfillment Cycle Time{SCCT} = {Time to Order and Receive Supplies} + {Order Fulfillment Cycle Time}SCCT=Time to Order and Receive Supplies+Order Fulfillment Cycle Time
Calculation Example: Time to order and receive supplies = 10 days, Order fulfillment cycle time = 5 days. SCCT = 10 + 5 = 15 days.
Chart Type: Area chart.
Color Scheme: Purple and blue showing process flow.
Business Question: What percentage of orders are delivered on time?
Definition: OTD measures the percentage of orders that are delivered as scheduled without delays.
Description: OTD reflects reliability in meeting customer expectations and supply chain efficiency.
Formula: OTD=(Total Orders−Orders Not On TimeTotal Orders)×100{OTD} = \left( \frac{{Total Orders} - {Orders Not On Time}}{{Total Orders}} \right) \times 100OTD=(Total OrdersTotal Orders−Orders Not On Time)×100
Calculation Example: Out of 200 orders, 180 were delivered on time. OTD = (180/200) * 100 = 90%.
Chart Type: Radar chart.
Color Scheme: Light blue representing punctuality.
Business Question: What percentage of sales is spent on supply chain operations?
Definition: Measures the efficiency of supply chain costs relative to overall sales revenue.
Description: This KPI helps evaluate cost-effectiveness and profitability.
Formula: Total Supply Chain Cost as % of Sales=(Total Supply Chain CostsTotal Sales)×100{Total Supply Chain Cost as \% of Sales} = \left( \frac{{Total Supply Chain Costs}}{{Total Sales}} \right) \times 100Total Supply Chain Cost as % of Sales=(Total SalesTotal Supply Chain Costs)×100
Calculation Example: Total supply chain costs = $500,000, Total sales = $2,000,000. Supply Chain Cost % = (500,000 / 2,000,000) * 100 = 25%.
Chart Type: Doughnut chart.
Color Scheme: Gray shades representing cost distribution.
Business Question: How many days will current inventory last based on current demand?
Definition: IDS measures the number of days inventory will last if no new inventory is added based on average daily demand.
Description: IDS helps manage inventory levels to balance stock availability and holding costs.
Formula: IDS=(Average Inventory ValueMonthly Demand)×30{IDS} = \left( \frac{{Average Inventory Value}}{{Monthly Demand}} \right) \times 30IDS=(Monthly DemandAverage Inventory Value)×30
Calculation Example: Average inventory value = $100,000, Monthly demand = $10,000. IDS = (100,000 / 10,000) * 30 = 300 days.
Chart Type: Heatmap.
Color Scheme: Green to red indicating inventory levels.
Business Question: How many days does it take to sell current inventory stock?
Definition: DSI measures how many days current inventory will last based on sales.
Description: DSI helps assess inventory turnover and stock management efficiency.
Formula: DSI=(Ending InventoryCost of Goods Sold)×Number of Days in Period{DSI} = \left( \frac{{Ending Inventory}}{{Cost of Goods Sold}} \right) \times {Number of Days in Period}DSI=(Cost of Goods SoldEnding Inventory)×Number of Days in Period
Calculation Example: Ending inventory = $50,000, Cost of Goods Sold = $200,000, Number of days = 90. DSI = (50,000 / 200,000) * 90 = 22.5 days.
Chart Type: Scatter plot.
Color Scheme: Blue shades indicating sales velocity.
Business Question: How accurate is our recorded inventory compared to physical counts?
Definition: IA measures the percentage of inventory records that match physical inventory counts.
Description: IA ensures inventory reliability and minimizes stock discrepancies.
Formula: IA=(Database Inventory CountPhysical Inventory Count)×100{IA} = \left( \frac{{Database Inventory Count}}{{Physical Inventory Count}} \right) \times 100IA=(Physical Inventory CountDatabase Inventory Count)×100
Calculation Example: Database inventory count = 5,000 units, Physical inventory count = 4,900 units. IA = (5,000 / 4,900) * 100 = 102.04%.
Chart Type: Box plot.
Color Scheme: Orange and yellow showing accuracy levels.
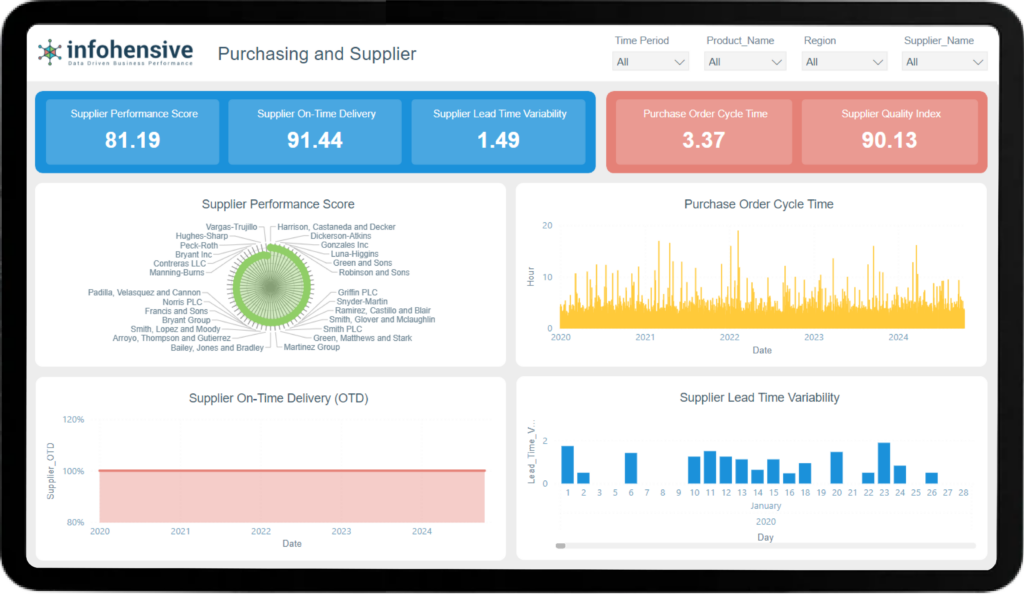
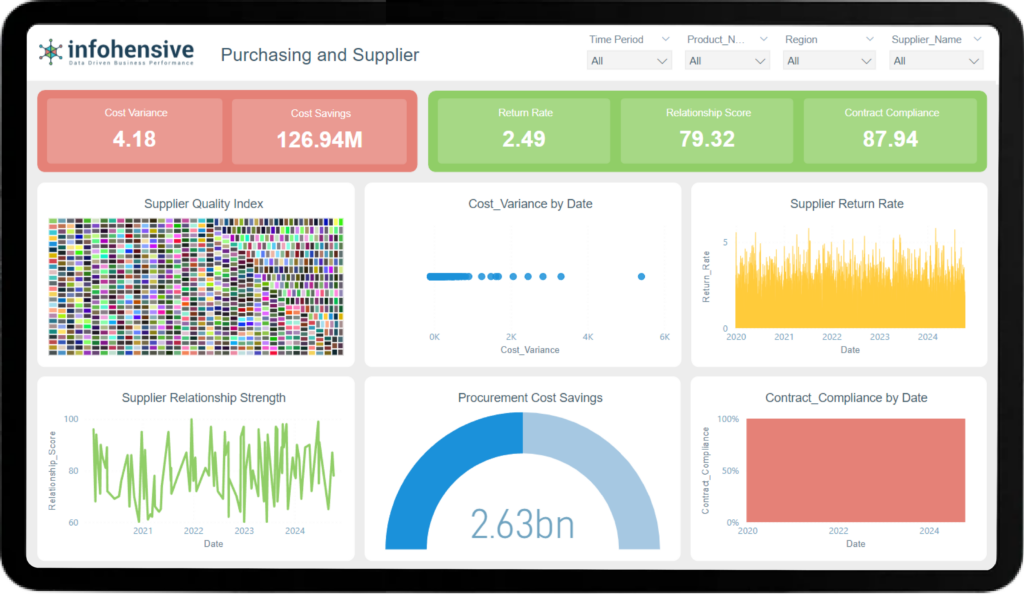
Business Question: How well are our suppliers performing?
Definition: Supplier performance score evaluates suppliers based on various metrics such as delivery reliability, quality, and cost-effectiveness.
Description: This KPI provides an overall assessment of supplier performance, crucial for maintaining efficient supply chain operations.
Formula: Aggregate score from individual metrics.
Calculation Example: Supplier A scored 85 out of 100 based on delivery, quality, and cost metrics.
Chart Type: Radar chart.
Color Scheme: Shades of green indicating supplier health.
Business Question: How long does it take to process purchase orders?
Definition: Purchase order cycle time measures the average time from order placement to receipt of goods.
Description: This KPI helps assess procurement efficiency and supplier responsiveness.
Formula: PO Cycle Time=Total PO Processing TimeNumber of Purchase Orders{PO Cycle Time} = \frac{{Total PO Processing Time}}{{Number of Purchase Orders}}PO Cycle Time=Number of Purchase OrdersTotal PO Processing Time
Calculation Example: Total PO processing time = 1,200 hours, Number of POs = 100. PO Cycle Time = 1,200 / 100 = 12 hours per PO.
Chart Type: Bar chart.
Color Scheme: Blue shades indicating efficiency.
Business Question: What percentage of orders do our suppliers deliver on time?
Definition: Supplier OTD measures the percentage of orders delivered by suppliers on the scheduled date.
Description: This KPI is critical for evaluating supplier reliability and its impact on production schedules.
Formula: Supplier OTD=(On-Time DeliveriesTotal Deliveries)×100{Supplier OTD} = \left( \frac{{On-Time Deliveries}}{{Total Deliveries}} \right) \times 100Supplier OTD=(Total DeliveriesOn-Time Deliveries)×100
Calculation Example: Supplier delivered 180 orders on time out of 200 total orders. Supplier OTD = (180 / 200) * 100 = 90%.
Chart Type: Line chart.
Color Scheme: Red and green showing delivery performance.
Business Question: How consistent are our suppliers in meeting lead times?
Definition: Supplier lead time variability measures the variation in lead times provided by suppliers.
Description: This KPI helps assess supply chain reliability and plan for variability in production schedules.
Formula: Standard deviation of lead times.
Calculation Example: Supplier A has a lead time variation of 2 days.
Chart Type: Histogram.
Color Scheme: Gray shades indicating variability.
Business Question: How well do our suppliers maintain product quality?
Definition: Supplier quality index evaluates the quality of products received from suppliers based on defect rates and quality inspections.
Description: This KPI ensures products meet quality standards, reducing rework and customer dissatisfaction.
Formula: Quality Index=(Defect-free ProductsTotal Products Received)×100{Quality Index} = \left( \frac{{Defect-free Products}}{{Total Products Received}} \right) \times 100Quality Index=(Total Products ReceivedDefect-free Products)×100
Calculation Example: Out of 500 products received, 480 were defect-free. Quality Index = (480 / 500) * 100 = 96%.
Chart Type: Pie chart.
Color Scheme: Blue and yellow representing quality levels.
Business Question: How much do supplier costs deviate from expected budgets?
Definition: Supplier cost variance measures the difference between expected and actual costs from suppliers.
Description: This KPI helps manage procurement budgets and identify cost-saving opportunities.
Formula: Cost Variance=(Actual Cost−Budgeted CostBudgeted Cost)×100{Cost Variance} = \left( \frac{{Actual Cost} - {Budgeted Cost}}{{Budgeted Cost}} \right) \times 100Cost Variance=(Budgeted CostActual Cost−Budgeted Cost)×100
Calculation Example: Budgeted cost = $50,000, Actual cost = $55,000. Cost Variance = ((55,000 - 50,000) / 50,000) * 100 = 10%.
Chart Type: Area chart.
Color Scheme: Red and green indicating budget adherence.
Business Question: What percentage of products do we return to suppliers due to defects?
Definition: Supplier return rate measures the percentage of products returned to suppliers out of total products received.
Description: This KPI assesses supplier quality and impacts on operational efficiency.
Formula: Return Rate=(Returned ProductsTotal Products Received)×100{Return Rate} = \left( \frac{{Returned Products}}{{Total Products Received}} \right) \times 100Return Rate=(Total Products ReceivedReturned Products)×100
Calculation Example: 20 products were returned out of 500 received. Return Rate = (20 / 500) * 100 = 4%.
Chart Type: Donut chart.
Color Scheme: Purple and gray indicating returns.
Business Question: How strong are our relationships with suppliers?
Definition: Supplier relationship strength measures factors such as communication, collaboration, and strategic alignment.
Description: This KPI helps assess partnerships for long-term sustainability and mutual benefits.
Formula: Qualitative assessment score.
Calculation Example: Rated on a scale from 1 to 5 based on supplier surveys and feedback.
Chart Type: Spider chart.
Color Scheme: Gradient from blue to green indicating relationship health.
Business Question: How much cost savings have procurement activities generated?
Definition: Procurement cost savings measure the monetary savings achieved through strategic purchasing initiatives.
Description: This KPI quantifies the financial impact of procurement strategies on overall profitability.
Formula: Cost Savings=Total Cost Savings Achieved{Cost Savings} = {Total Cost Savings Achieved}Cost Savings=Total Cost Savings Achieved
Calculation Example: Identified $100,000 in cost savings through negotiation and sourcing improvements.
Chart Type: Column chart.
Color Scheme: Gold and brown indicating financial gains.
Business Question: How well do suppliers adhere to contractual agreements?
Definition: Supplier contract compliance measures the percentage of compliance with terms and conditions set in supplier contracts.
Description: This KPI ensures suppliers meet agreed-upon obligations, mitigating risks and optimizing performance.
Formula: Contract Compliance=(Compliant ActionsTotal Actions)×100{Contract Compliance} = \left( \frac{{Compliant Actions}}{{Total Actions}} \right) \times 100Contract Compliance=(Total ActionsCompliant Actions)×100
Calculation Example: Out of 100 actions, 90 were compliant with contract terms. Contract Compliance = (90 / 100) * 100 = 90%.
Chart Type: Gauge chart.
Color Scheme: Orange to green showing compliance levels.
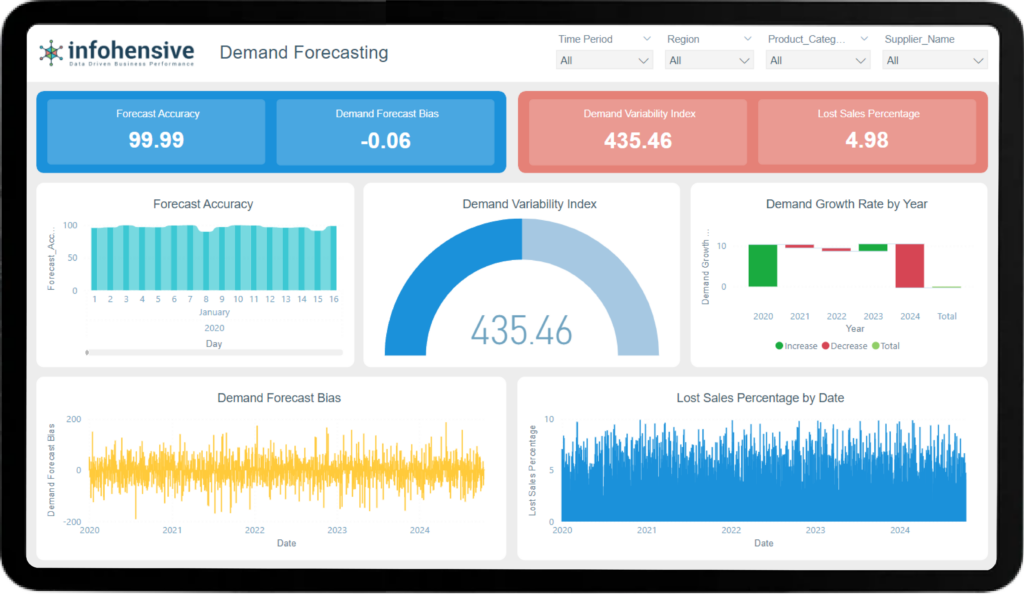
Business Question: How accurate are our demand forecasts?
Definition: Forecast accuracy measures the closeness of predicted demand to actual demand.
Description: This KPI evaluates the reliability of forecasting models in predicting future demand.
Formula: Forecast Accuracy=(Actual Demand - Forecasted DemandActual Demand)×100{Forecast Accuracy} = \left( \frac{{Actual Demand - Forecasted Demand}}{{Actual Demand}} \right) \times 100Forecast Accuracy=(Actual DemandActual Demand - Forecasted Demand)×100
Calculation Example: Actual demand = 1,000 units, Forecasted demand = 900 units. Forecast Accuracy = ((1,000 - 900) / 1,000) * 100 = 10%.
Chart Type: Line chart.
Color Scheme: Blue and gray indicating accuracy levels.
Business Question: How volatile is our demand?
Definition: Demand variability index measures the degree of fluctuation in demand over a period.
Description: This KPI helps assess the stability of demand patterns, influencing inventory and production planning.
Formula: Standard deviation of demand.
Calculation Example: Standard deviation of monthly demand = 200 units.
Chart Type: Bar chart.
Color Scheme: Red shades showing variability.
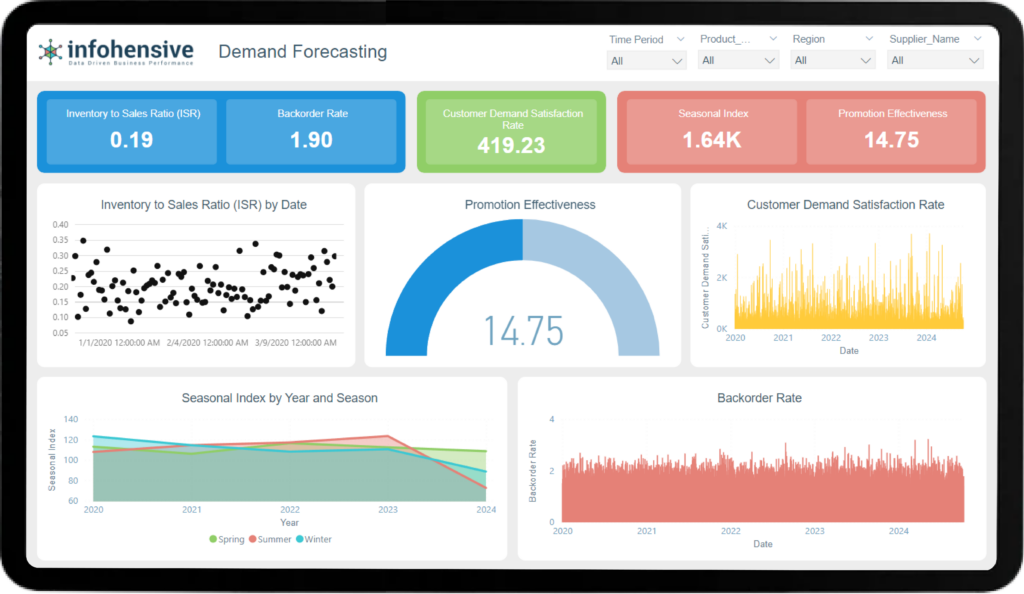
Business Question: How do seasonal trends affect demand?
Definition: Seasonal index measures the relative strength of seasonal factors influencing demand.
Description: This KPI identifies seasonal patterns in demand, aiding in seasonal inventory management and marketing strategies.
Formula: Seasonal Index=Average Demand in SeasonAverage Demand Overall{Seasonal Index} = \frac{{Average Demand in Season}}{{Average Demand Overall}}Seasonal Index=Average Demand OverallAverage Demand in Season
Calculation Example: Average demand in summer = 1,200 units, Average demand overall = 1,000 units. Seasonal Index = 1,200 / 1,000 = 1.2.
Chart Type: Area chart.
Color Scheme: Warm colors (orange, yellow) representing seasons.
Business Question: Are our forecasts consistently overestimating or underestimating demand?
Definition: Demand forecast bias measures the tendency of forecasts to consistently over-predict or under-predict demand.
Description: This KPI helps identify systematic errors in forecasting models, improving forecast accuracy.
Formula: Forecast Bias=(Sum of Forecast ErrorsNumber of Forecasts){Forecast Bias} = \left( \frac{{Sum of Forecast Errors}}{{Number of Forecasts}} \right)Forecast Bias=(Number of ForecastsSum of Forecast Errors)
Calculation Example: Sum of forecast errors = +200 units (overestimation). Number of forecasts = 10. Forecast Bias = 200 / 10 = +20 units.
Chart Type: Radar chart.
Color Scheme: Blue to indicate deviation.
Business Question: How fast is demand for our products growing?
Definition: Demand growth rate measures the percentage change in demand over a specified period.
Description: This KPI helps assess market expansion opportunities and capacity planning.
Formula: Demand Growth Rate=(Current Demand−Previous DemandPrevious Demand)×100{Demand Growth Rate} = \left( \frac{{Current Demand} - {Previous Demand}}{{Previous Demand}} \right) \times 100Demand Growth Rate=(Previous DemandCurrent Demand−Previous Demand)×100
Calculation Example: Previous month demand = 1,000 units, Current month demand = 1,200 units. Demand Growth Rate = ((1,200 - 1,000) / 1,000) * 100 = 20%.
Chart Type: Line chart.
Color Scheme: Green shades representing growth.
Business Question: What percentage of potential sales are lost due to stockouts?
Definition: Lost sales percentage measures the portion of sales lost because products are not available in stock.
Description: This KPI quantifies the impact of stockouts on revenue and customer satisfaction.
Formula: Lost Sales %=(Number of Lost SalesTotal Demand)×100{Lost Sales \%} = \left( \frac{{Number of Lost Sales}}{{Total Demand}} \right) \times 100Lost Sales %=(Total DemandNumber of Lost Sales)×100
Calculation Example: 50 units were lost due to stockouts out of a total demand of 1,000 units. Lost Sales % = (50 / 1,000) * 100 = 5%.
Chart Type: Bar chart.
Color Scheme: Red indicating lost opportunities.
Business Question: How well aligned is our inventory with sales expectations?
Definition: ISR measures the relationship between inventory levels and sales volume.
Description: This KPI helps optimize inventory levels to balance supply and demand efficiently.
Formula: ISR=(InventoryNet Sales){ISR} = \left( \frac{{Inventory}}{{Net Sales}} \right)ISR=(Net SalesInventory)
Calculation Example: Inventory = $100,000, Net sales = $500,000. ISR = 100,000 / 500,000 = 0.2.
Chart Type: Pie chart.
Color Scheme: Blue and green indicating balance.
Business Question: How satisfied are customers with product availability?
Definition: Customer demand satisfaction rate measures the percentage of customer demand fulfilled.
Description: This KPI assesses customer satisfaction related to product availability and delivery.
Formula: Demand Satisfaction Rate=(Fulfilled DemandTotal Demand)×100{Demand Satisfaction Rate} = \left( \frac{{Fulfilled Demand}}{{Total Demand}} \right) \times 100Demand Satisfaction Rate=(Total DemandFulfilled Demand)×100
Calculation Example: 900 units were delivered out of 1,000 units demanded. Demand Satisfaction Rate = (900 / 1,000) * 100 = 90%.
Chart Type: Doughnut chart.
Color Scheme: Purple and gray showing satisfaction levels.
Business Question: What percentage of orders are backordered due to insufficient inventory?
Definition: Backorder rate measures the percentage of orders that cannot be fulfilled immediately due to stockouts.
Description: This KPI indicates inventory management effectiveness and customer service levels.
Formula: Backorder Rate=(Backordered OrdersTotal Orders)×100{Backorder Rate} = \left( \frac{{Backordered Orders}}{{Total Orders}} \right) \times 100Backorder Rate=(Total OrdersBackordered Orders)×100
Calculation Example: 20 orders were backordered out of 200 total orders. Backorder Rate = (20 / 200) * 100 = 10%.
Chart Type: Line chart.
Color Scheme: Orange and yellow indicating fulfillment issues.
Business Question: How effective are promotions in driving demand?
Definition: Promotion effectiveness measures the impact of marketing promotions on demand.
Description: This KPI evaluates the ROI of promotional activities and informs future marketing strategies.
Formula: Promotion Effectiveness=(Sales During PromotionBaseline Sales−1)×100{Promotion Effectiveness} = \left( \frac{{Sales During Promotion}}{{Baseline Sales}} - 1 \right) \times 100Promotion Effectiveness=(Baseline SalesSales During Promotion−1)×100
Calculation Example: Baseline sales = $50,000, Sales during promotion = $70,000. Promotion Effectiveness = ((70,000 / 50,000) - 1) * 100 = 40%.
Chart Type: Area chart.
Color Scheme: Green to indicate promotional impact.
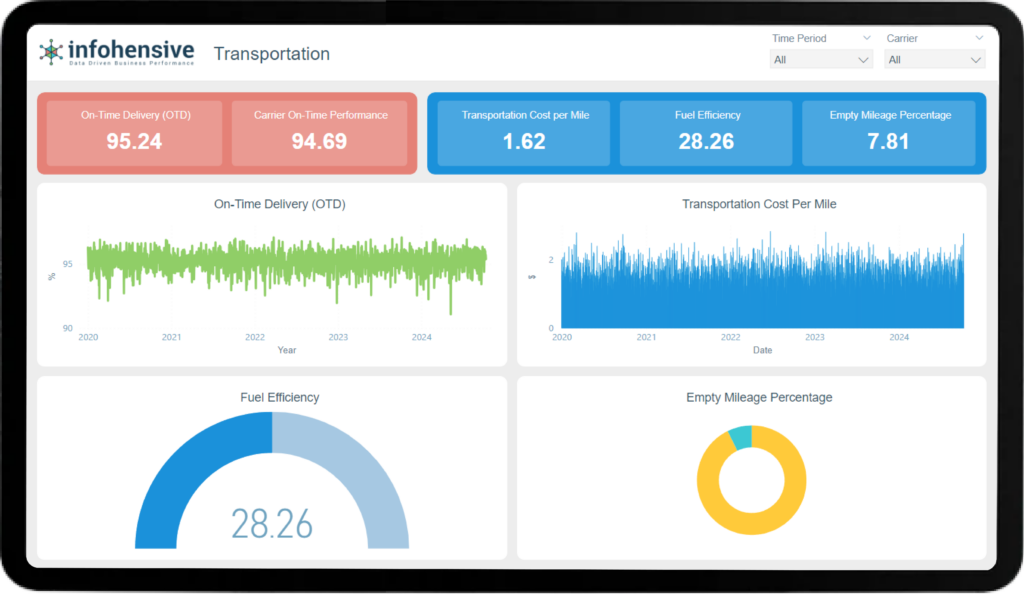
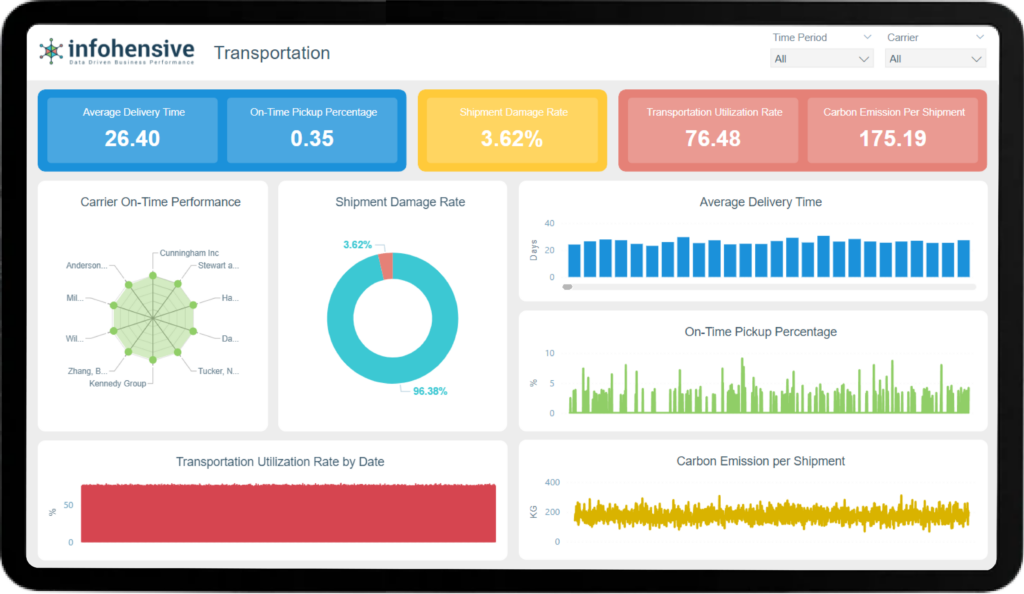
Business Question: How reliable is our transportation in delivering goods on time?
Definition: On-Time Delivery measures the percentage of shipments delivered on or before the scheduled delivery date.
Description: This KPI is critical for evaluating transportation efficiency and its impact on customer satisfaction.
Formula: OTD=(On-Time DeliveriesTotal Deliveries)×100{OTD} = \left( \frac{{On-Time Deliveries}}{{Total Deliveries}} \right) \times 100OTD=(Total DeliveriesOn-Time Deliveries)×100
Calculation Example: 900 shipments delivered on time out of 1,000 total shipments. OTD = (900 / 1,000) * 100 = 90%.
Chart Type: Line chart.
Color Scheme: Green indicating delivery performance.
Business Question: How cost-effective is our transportation network?
Definition: Transportation cost per mile/kilometer measures the average cost incurred for transporting goods per unit distance.
Description: This KPI helps assess the financial efficiency of transportation operations and identifies cost-saving opportunities.
Formula: Cost per Mile/Kilometer=Total Transportation CostTotal Distance Traveled{Cost per Mile/Kilometer} = \frac{{Total Transportation Cost}}{{Total Distance Traveled}}Cost per Mile/Kilometer=Total Distance TraveledTotal Transportation Cost
Calculation Example: Total transportation cost = $10,000, Total distance traveled = 5,000 miles. Cost per mile = $10,000 / 5,000 = $2 per mile.
Chart Type: Bar chart.
Color Scheme: Blue shades representing cost analysis.
Business Question: How efficiently are we using fuel in our transportation operations?
Definition: Fuel efficiency measures the amount of fuel consumed per unit of distance traveled.
Description: This KPI is crucial for monitoring environmental impact and optimizing fuel costs.
Formula: Fuel Efficiency=Distance TraveledFuel Consumed{Fuel Efficiency} = \frac{{Distance Traveled}}{{Fuel Consumed}}Fuel Efficiency=Fuel ConsumedDistance Traveled
Calculation Example: Distance traveled = 10,000 miles, Fuel consumed = 500 gallons. Fuel Efficiency = 10,000 / 500 = 20 miles per gallon.
Chart Type: Gauge chart.
Color Scheme: Green to red indicating efficiency levels.
Business Question: What percentage of transportation miles are driven with empty vehicles?
Definition: Empty mileage percentage measures the proportion of miles traveled with no cargo or passengers.
Description: This KPI helps assess resource utilization and identifies opportunities to reduce empty miles.
Formula: Empty Mileage %=(Empty MilesTotal Miles)×100{Empty Mileage \%} = \left( \frac{{Empty Miles}}{{Total Miles}} \right) \times 100Empty Mileage %=(Total MilesEmpty Miles)×100
Calculation Example: 1,000 empty miles out of 5,000 total miles traveled. Empty Mileage % = (1,000 / 5,000) * 100 = 20%.
Chart Type: Pie chart.
Color Scheme: Gray and blue indicating utilization.
Business Question: How reliable are our transportation carriers in meeting delivery schedules?
Definition: Carrier on-time performance measures the percentage of shipments delivered by specific carriers on time.
Description: This KPI evaluates carrier reliability and informs carrier selection decisions.
Formula: Carrier OTP=(On-Time Deliveries by CarrierTotal Deliveries by Carrier)×100{Carrier OTP} = \left( \frac{{On-Time Deliveries by Carrier}}{{Total Deliveries by Carrier}} \right) \times 100Carrier OTP=(Total Deliveries by CarrierOn-Time Deliveries by Carrier)×100
Calculation Example: Carrier A delivered 180 shipments on time out of 200 total shipments. Carrier OTP = (180 / 200) * 100 = 90%.
Chart Type: Radar chart.
Color Scheme: Gradient indicating carrier performance.
Business Question: What is the average time taken for deliveries?
Definition: Average delivery time measures the average duration from shipment dispatch to delivery completion.
Description: This KPI helps assess transportation efficiency and customer service levels.
Formula: Average Delivery Time=Total Delivery TimeNumber of Deliveries{Average Delivery Time} = \frac{{Total Delivery Time}}{{Number of Deliveries}}Average Delivery Time=Number of DeliveriesTotal Delivery Time
Calculation Example: Total delivery time = 500 hours, Number of deliveries = 100. Average Delivery Time = 500 / 100 = 5 hours.
Chart Type: Column chart.
Color Scheme: Orange to yellow indicating delivery speed.
Business Question: What percentage of shipments incur damages during transportation?
Definition: Shipment damage rate measures the percentage of shipments that arrive damaged or compromised.
Description: This KPI evaluates transportation handling and packaging effectiveness.
Formula: Damage Rate=(Damaged ShipmentsTotal Shipments)×100{Damage Rate} = \left( \frac{{Damaged Shipments}}{{Total Shipments}} \right) \times 100Damage Rate=(Total ShipmentsDamaged Shipments)×100
Calculation Example: 50 shipments arrived damaged out of 1,000 total shipments. Damage Rate = (50 / 1,000) * 100 = 5%.
Chart Type: Donut chart.
Color Scheme: Red and gray indicating damage incidents.
Business Question: How often are pickups made on schedule?
Definition: On-Time Pickup Percentage measures the percentage of pickups completed as per the scheduled time.
Description: This KPI ensures efficient coordination between suppliers and transportation providers.
Formula: On-Time Pickup %=(On-Time PickupsTotal Pickups)×100{On-Time Pickup \%} = \left( \frac{{On-Time Pickups}}{{Total Pickups}} \right) \times 100On-Time Pickup %=(Total PickupsOn-Time Pickups)×100
Calculation Example: 900 pickups were on time out of 1,000 total pickups. On-Time Pickup % = (900 / 1,000) * 100 = 90%.
Chart Type: Area chart.
Color Scheme: Green and blue showing pickup reliability.
Business Question: How efficiently are transportation assets utilized?
Definition: Transportation utilization rate measures the percentage of time transportation assets are in use compared to available time.
Description: This KPI helps optimize asset deployment and reduce idle time.
Formula: Utilization Rate=(Actual Transportation HoursAvailable Transportation Hours)×100{Utilization Rate} = \left( \frac{{Actual Transportation Hours}}{{Available Transportation Hours}} \right) \times 100Utilization Rate=(Available Transportation HoursActual Transportation Hours)×100
Calculation Example: Actual transportation hours = 800 hours, Available transportation hours = 1,000 hours. Utilization Rate = (800 / 1,000) * 100 = 80%.
Chart Type: Gauge chart.
Color Scheme: Blue to purple indicating efficiency.
Business Question: What is the environmental impact of our transportation activities?
Definition: Carbon emission per shipment measures the amount of carbon dioxide emitted per unit of shipment.
Description: This KPI helps track environmental sustainability efforts and carbon footprint reduction strategies.
Formula: Carbon Emission per Shipment=Total Carbon EmissionNumber of Shipments{Carbon Emission per Shipment} = \frac{{Total Carbon Emission}}{{Number of Shipments}}Carbon Emission per Shipment=Number of ShipmentsTotal Carbon Emission
Calculation Example: Total carbon emission = 1,000 kg, Number of shipments = 500. Carbon Emission per Shipment = 1,000 / 500 = 2 kg/shipment.
Chart Type: Line chart.
Color Scheme: Green and brown indicating environmental impact.

