Kpi's in Finance
Transform Operations, Enhance Productivity, and Drive Growth with Data-Driven Insights.
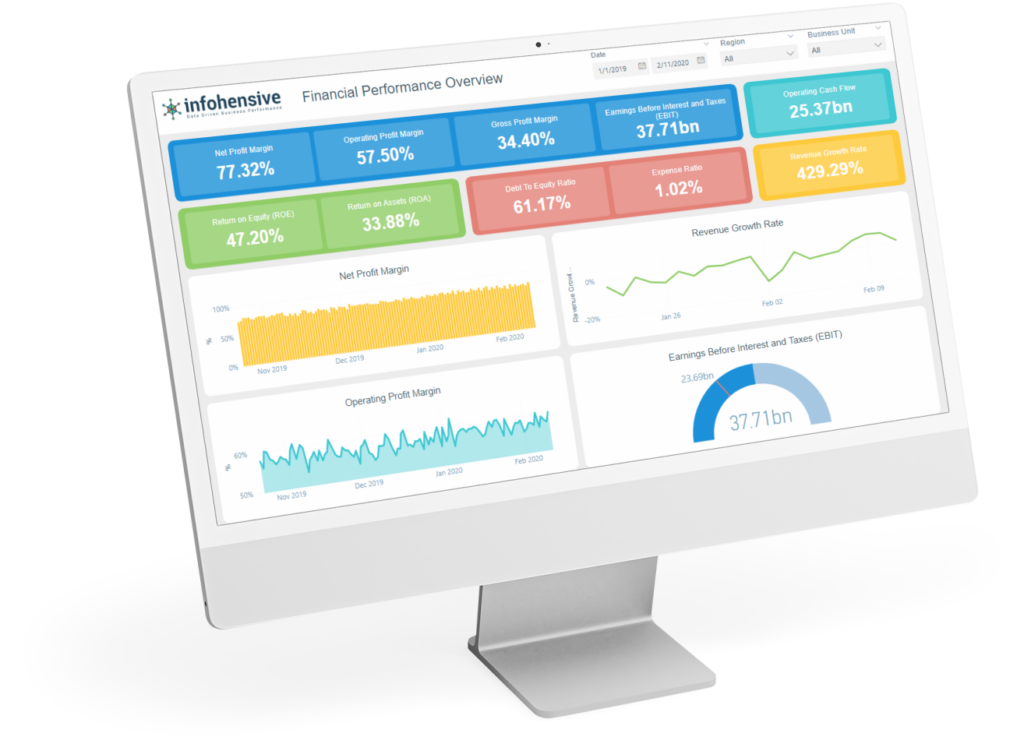
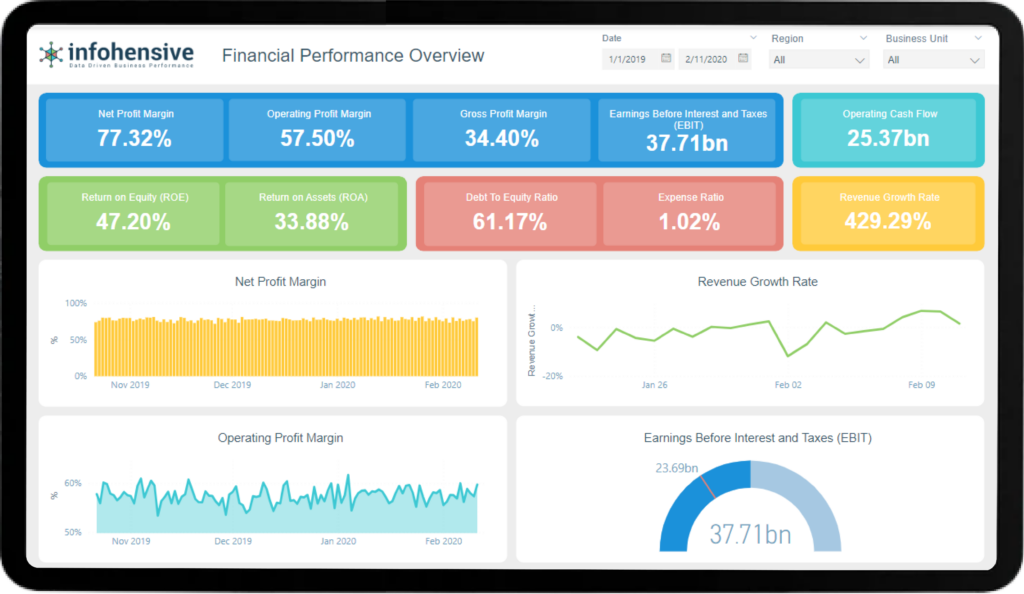
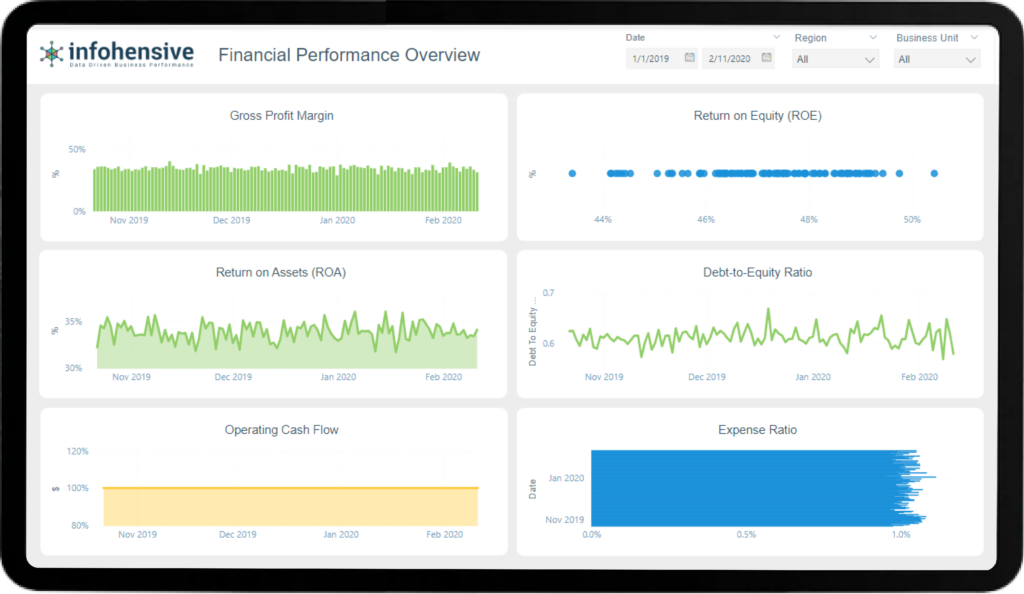
Business Question: How profitable is the company after all expenses have been paid?
Definition: The percentage of revenue remaining after all costs, taxes, and expenses have been deducted.
Description: This KPI indicates how efficiently the company converts revenue into actual profit, showing profitability after all costs.
Formula: (Net Profit / Revenue) * 100
Calculation Example: If a company earns $500,000 in revenue and has $100,000 in net profit, the Net Profit Margin is (100,000 / 500,000) * 100 = 20%.
Business Question: How fast is the company’s revenue growing over a specific period?
Definition: The percentage increase or decrease in revenue over a defined period.
Description: This KPI helps assess whether the company's sales are increasing or declining and by what percentage.
Formula: [(Current Period Revenue - Previous Period Revenue) / Previous Period Revenue] * 100
Calculation Example: If last quarter's revenue was $400,000 and this quarter’s revenue is $500,000, the Revenue Growth Rate is [(500,000 - 400,000) / 400,000] * 100 = 25%.
Business Question: How efficiently does the company manage its core business operations?
Definition: The percentage of revenue left after subtracting operating expenses but before interest and taxes.
Description: This KPI shows profitability from business operations, excluding non-operating expenses.
Formula: (Operating Profit / Revenue) * 100
Calculation Example: If a company’s revenue is $600,000 and its operating profit is $150,000, the Operating Profit Margin is (150,000 / 600,000) * 100 = 25%.
Business Question: How much profit does the company generate from its operations before accounting for interest and taxes?
Definition: The total earnings from operations before deducting interest expenses and income taxes.
Description: EBIT reflects the company’s operational profitability without considering external financial costs.
Formula: Revenue - Operating Expenses
Calculation Example: If a company generates $800,000 in revenue and has $500,000 in operating expenses, the EBIT is $800,000 - $500,000 = $300,000.
Business Question: How much profit is the company generating after accounting for the cost of goods sold?
Definition: The percentage of revenue remaining after subtracting the cost of goods sold (COGS).
Description: This KPI helps understand the company’s ability to cover its operational expenses with the remaining revenue after direct production costs.
Formula: (Gross Profit / Revenue) * 100
Calculation Example: If a company has $700,000 in revenue and $300,000 in COGS, the Gross Profit Margin is [(700,000 - 300,000) / 700,000] * 100 = 57.14%.
Business Question: How efficiently is the company generating profit from shareholders' investments?
Definition: A measure of the profitability relative to shareholders' equity.
Description: ROE indicates how effectively management is using shareholders' funds to generate profits.
Formula: (Net Income / Shareholders' Equity) * 100
Calculation Example: If a company has $200,000 in net income and $1,000,000 in shareholders' equity, ROE is (200,000 / 1,000,000) * 100 = 20%.
Business Question: How effectively is the company using its assets to generate profit?
Definition: The percentage of profit generated from total assets.
Description: This KPI indicates how well the company is using its assets to produce profits, showing the efficiency of its asset utilization.
Formula: (Net Income / Total Assets) * 100
Calculation Example: If the company has $150,000 in net income and $1,500,000 in assets, the ROA is (150,000 / 1,500,000) * 100 = 10%.
Business Question: How much debt does the company have relative to its equity?
Definition: A ratio that measures the company’s financial leverage by comparing its total debt to shareholders' equity.
Description: The Debt-to-Equity Ratio shows how heavily the company relies on debt to finance its assets.
Formula: Total Liabilities / Shareholders' Equity
Calculation Example: If a company has $500,000 in total liabilities and $1,000,000 in shareholders' equity, the Debt-to-Equity Ratio is 500,000 / 1,000,000 = 0.5.
Business Question: How much cash is the company generating from its core operations?
Definition: The amount of cash generated by the company’s core business activities, indicating liquidity and the ability to maintain operations.
Description: Operating Cash Flow measures how well the company can generate cash to fund operating expenses and investments.
Formula: Net Income + Non-Cash Expenses (Depreciation/Amortization) - Changes in Working Capital
Calculation Example: If a company has a net income of $300,000, depreciation of $50,000, and a working capital increase of $30,000, the Operating Cash Flow is 300,000 + 50,000 - 30,000 = $320,000. velocity.
Business Question: What portion of the company's revenue is consumed by operational expenses?
Definition: The ratio of operating expenses to revenue.
Description: This KPI measures the efficiency of the company in managing its operating expenses relative to the revenue generated.
Formula: (Operating Expenses / Revenue) * 100
Calculation Example: If a company has $400,000 in revenue and $100,000 in operating expenses, the Expense Ratio is (100,000 / 400,000) * 100 = 25%.
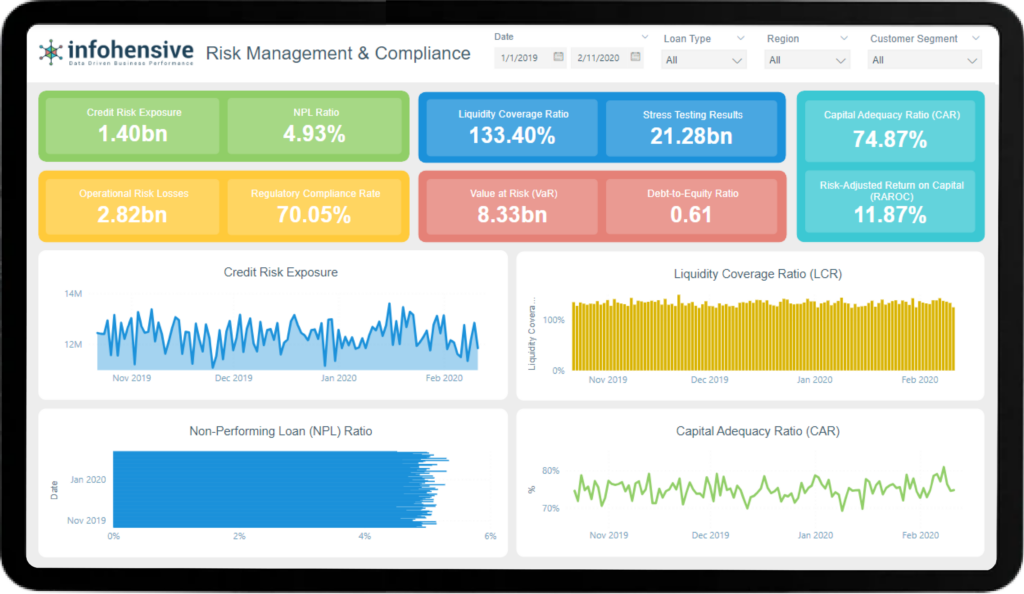
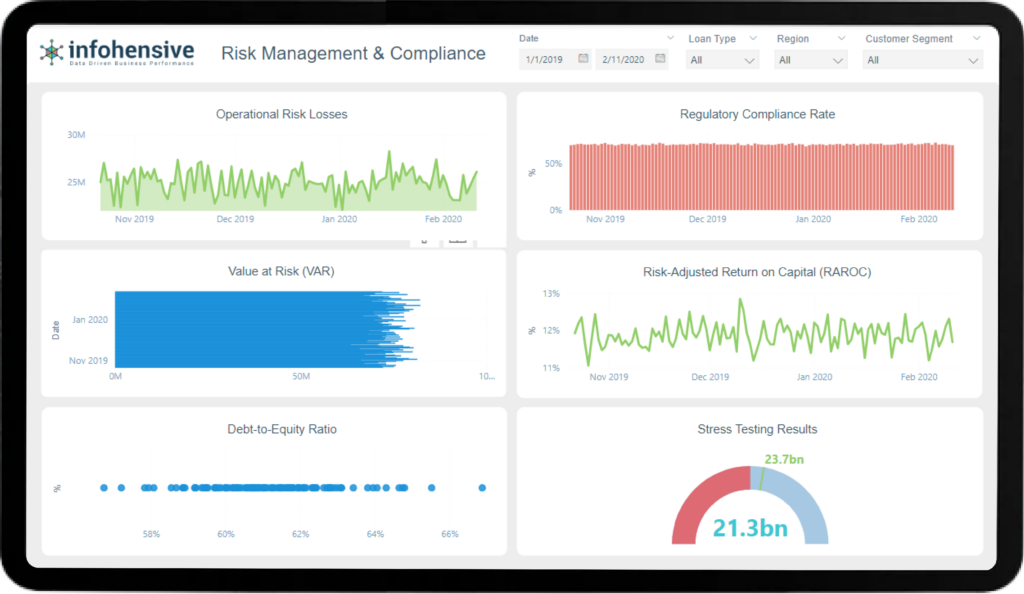
Business Question: How much of the company’s assets are at risk of default?
Definition: The total value of loans, receivables, or other financial assets that are potentially at risk of non-payment or default.
Description: This KPI is crucial for measuring how much of the company’s portfolio is exposed to credit risk, helping in evaluating the potential losses due to defaults.
Formula: Sum of all outstanding loans at risk of default.
Calculation Example: If a company has $200 million in outstanding loans and $20 million is at risk of default, the Credit Risk Exposure is $20 million.
Business Question: How well can the company meet short-term financial obligations using liquid assets?
Definition: The ratio of highly liquid assets to short-term liabilities, measuring the company’s ability to cover short-term obligations.
Description: LCR is used to ensure that a financial institution holds sufficient liquid assets to withstand a 30-day financial stress scenario.
Formula: (High-Quality Liquid Assets / Total Net Cash Outflows over 30 days) * 100
Calculation Example: If a company has $50 million in high-quality liquid assets and $40 million in net cash outflows, the LCR is (50,000,000 / 40,000,000) * 100 = 125%.
Business Question: What percentage of the company’s loans are not generating interest or are close to default?
Definition: The ratio of non-performing loans to the total loan portfolio.
Description: This KPI measures the proportion of loans in default or close to default, indicating potential credit risk issues.
Formula: (Non-Performing Loans / Total Loans) * 100
Calculation Example: If a bank has $1 billion in loans and $50 million are non-performing, the NPL Ratio is (50,000,000 / 1,000,000,000) * 100 = 5%.
Business Question: How much capital does the company have to cover its risk-weighted assets?
Definition: The ratio of a bank’s capital to its risk-weighted assets, used to ensure financial stability.
Description: CAR ensures that a bank can absorb a reasonable amount of loss and complies with statutory capital requirements.
Formula: (Tier 1 Capital + Tier 2 Capital) / Risk-Weighted Assets
Calculation Example: If a bank has $100 million in Tier 1 and Tier 2 capital and $800 million in risk-weighted assets, the CAR is (100,000,000 / 800,000,000) = 12.5%.
Business Question: How much financial loss is the company incurring due to operational risks such as fraud, system failures, or human errors?
Definition: The total value of losses incurred due to operational risks.
Description: This KPI tracks the financial impact of losses stemming from operational failures, helping identify areas needing improvement.
Formula: Sum of all operational losses over a defined period.
Calculation Example: If a company experiences $2 million in fraud-related losses and $1 million in system failures, the total Operational Risk Losses are $3 million.
Business Question: What percentage of regulatory requirements is the company compliant with?
Definition: The percentage of regulatory requirements met by the company out of the total applicable regulations.
Description: This KPI tracks how well the company is adhering to financial and legal regulations to avoid penalties and operational risks.
Formula: (Number of Complied Regulations / Total Applicable Regulations) * 100
Calculation Example: If a company complies with 180 out of 200 applicable regulations, the Regulatory Compliance Rate is (180 / 200) * 100 = 90%.
Business Question: What is the maximum potential loss the company could face within a specific time frame and confidence level?
Definition: The maximum loss a portfolio could experience over a set time period with a given probability, under normal market conditions.
Description: VaR helps assess the potential downside risk of a portfolio and how much capital is at risk.
Formula: VaR = (Z-Score * Standard Deviation * Portfolio Value)
Calculation Example: If a portfolio value is $100 million, the standard deviation is 5%, and the Z-score is 1.65 (95% confidence level), the VaR is 1.65 * 0.05 * 100,000,000 = $8.25 million.
Business Question: How much profit is the company generating relative to the risks it is taking?
Definition: The return generated by the company or a business unit after accounting for the risks taken to achieve that return.
Description: RAROC provides a more accurate assessment of profitability by adjusting for the level of risk associated with a particular investment or business activity.
Formula: (Net Income / Risk-Weighted Capital) * 100
Calculation Example: If a company generates $15 million in net income on $100 million of risk-weighted capital, the RAROC is (15,000,000 / 100,000,000) * 100 = 15%.
Business Question: How much of the company’s financing comes from debt compared to equity?
Definition: The ratio of total liabilities to shareholders’ equity, indicating the extent of financial leverage.
Description: This KPI shows how heavily the company relies on debt to finance its operations, which can indicate financial risk.
Formula: Total Liabilities / Shareholders’ Equity
Calculation Example: If a company has $400 million in liabilities and $200 million in equity, the Debt-to-Equity Ratio is 400,000,000 / 200,000,000 = 2.
Business Question: How would the company perform under adverse economic or financial conditions?
Definition: The results of simulations that assess the impact of extreme scenarios on the company’s financial health.
Description: Stress testing helps identify potential vulnerabilities in the company’s capital and liquidity under various adverse conditions.
Formula: No standard formula—depends on specific scenarios such as market crashes or liquidity crises.
Calculation Example: If a stress test shows that a company would lose $30 million in a severe recession scenario, this result indicates the company’s exposure to economic downturns.
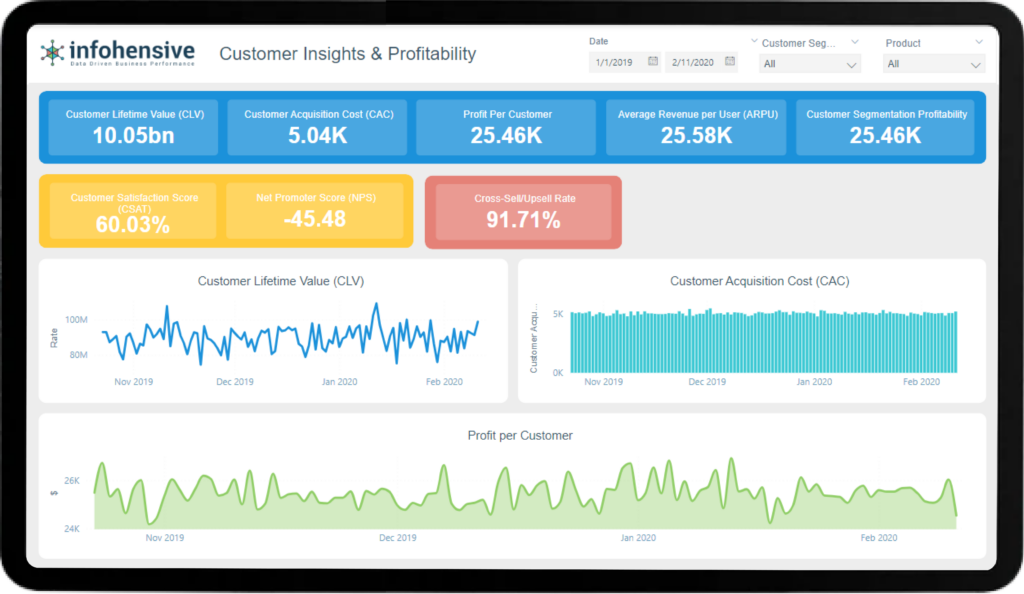
Business Question: How much revenue can we expect to generate from a single customer over their entire relationship with our company?
Definition: The total revenue a business expects to earn from a customer throughout their lifetime with the company.
Description: CLV helps estimate the profitability of a customer over time, guiding strategies for customer retention and acquisition investment.
Formula: (Average Purchase Value) x (Number of Purchases per Year) x (Average Customer Lifespan)
Calculation Example: If a customer spends $500 per purchase, buys 4 times a year, and stays with the company for 5 years, the CLV is $500 x 4 x 5 = $10,000.
Business Question: How much does it cost the company to acquire a new customer?
Definition: The total cost of acquiring a new customer, including marketing and sales expenses.
Description: CAC helps businesses evaluate the efficiency of their customer acquisition strategies by comparing costs to the value of customers acquired.
Formula: Total Sales and Marketing Costs / Number of New Customers Acquired
Calculation Example: If a company spends $100,000 on marketing and sales to acquire 500 customers, the CAC is $100,000 / 500 = $200 per customer.
Business Question: What percentage of customers are staying with the company over a specified time period?
Definition: The percentage of customers who continue to do business with the company during a given time period.
Description: Customer retention rate reflects the effectiveness of a company’s customer loyalty efforts, showing how well the business is maintaining its customer base.
Formula: [(Number of Customers at End of Period - New Customers During Period) / Number of Customers at Start of Period] * 100
Calculation Example: If a company had 1,000 customers at the start of the month, gained 200 new customers, and ended the month with 1,150 customers, the retention rate is [(1,150 - 200) / 1,000] * 100 = 95%.
Business Question: How many customers are leaving the company during a specific time period?
Definition: The percentage of customers who discontinue their relationship with the company over a given period.
Description: Churn rate shows how quickly a company is losing customers, providing insights into areas where customer satisfaction and retention efforts may be lacking.
Formula: (Number of Customers Lost During Period / Number of Customers at Start of Period) * 100
Calculation Example: If a company starts with 1,000 customers and loses 100 customers over the month, the churn rate is (100 / 1,000) * 100 = 10%.
Business Question: How much profit does each customer generate for the company?
Definition: The average profit generated from each individual customer over a specific period.
Description: This KPI measures how much each customer contributes to the company’s bottom line, helping in identifying high-value customer segments.
Formula: Total Profit / Number of Customers
Calculation Example: If a company generates $500,000 in profit from 2,000 customers, the Profit per Customer is $500,000 / 2,000 = $250.
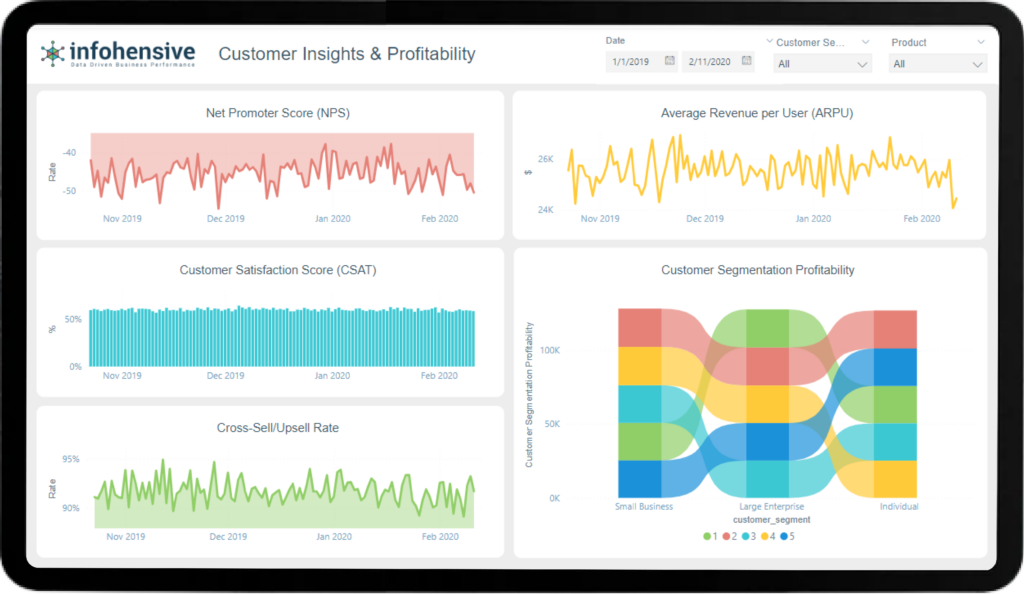
Business Question: How satisfied are our customers with our products or services?
Definition: A metric that measures customer satisfaction by asking customers to rate their experience on a scale, typically from 1 to 5 or 1 to 10.
Description: CSAT provides direct feedback from customers, helping the company assess how well it is meeting customer expectations.
Formula: (Sum of All Customer Satisfaction Scores / Total Number of Responses) * 100
Calculation Example: If 500 customers provide satisfaction scores totaling 4,500 points, the CSAT is (4,500 / 500) * 100 = 90%.
Business Question: How likely are customers to recommend our company to others?
Definition: A measure of customer loyalty based on how likely customers are to recommend the company, rated on a scale from 0 to 10.
Description: NPS gauges customer satisfaction and the likelihood of customers becoming promoters of the brand, helping to predict growth through word-of-mouth.
Formula: % of Promoters (customers who rate 9-10) - % of Detractors (customers who rate 0-6)
Calculation Example: If 60% of customers are promoters and 15% are detractors, the NPS is 60% - 15% = 45.
Business Question: How much revenue does the company generate from each customer on average?
Definition: The average amount of revenue generated per customer over a given period.
Description: ARPU helps companies assess the revenue generated by each customer, often used to measure the profitability of customer segments or product lines.
Formula: Total Revenue / Number of Customers
Calculation Example: If a company generates $1,000,000 in revenue from 5,000 customers, the ARPU is $1,000,000 / 5,000 = $200.
Business Question: How many customers are purchasing additional or upgraded products/services?
Definition: The percentage of customers who buy complementary or higher-end products in addition to their original purchase.
Description: Cross-sell/upsell rates help measure the success of efforts to increase the lifetime value of customers by offering them additional products or services.
Formula: (Number of Customers Who Made Additional Purchases / Total Number of Customers) * 100
Calculation Example: If 300 customers out of 1,500 made additional purchases, the Cross-Sell/Upsell Rate is (300 / 1,500) * 100 = 20%.
Business Question: How profitable are the different segments of customers to the company?
Definition: The measure of profitability for different customer groups, typically based on factors such as age, geography, or purchasing habits.
Description: This KPI helps companies focus on their most profitable customer segments by analyzing the revenue and profit generated by each group.
Formula: Total Profit from Segment / Total Number of Customers in Segment
Calculation Example: If a company generates $200,000 in profit from 500 high-income customers, the Customer Segmentation Profitability for that group is $200,000 / 500 = $400 per customer.
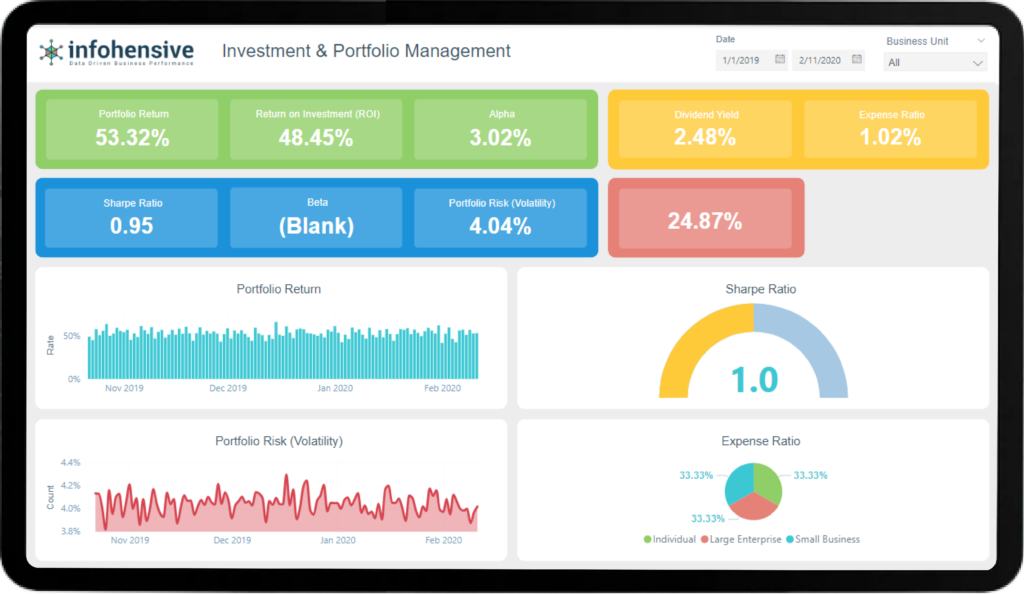
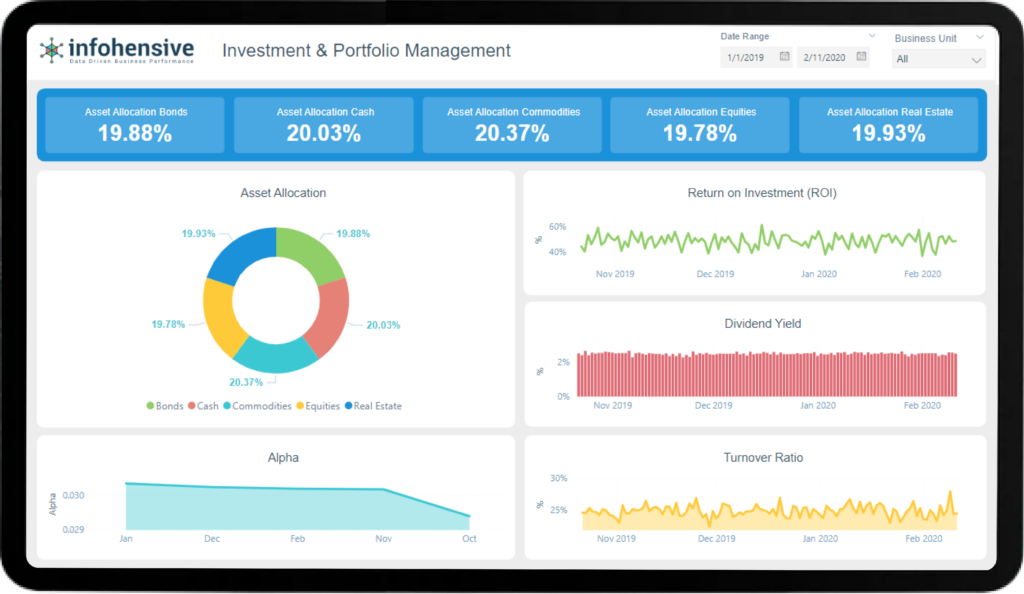
Business Question: How much return has the investment portfolio generated over a specific period?
Definition: The total gain or loss generated by an investment portfolio during a given time frame.
Description: Portfolio return measures the overall performance of a portfolio, allowing investors to assess how their investments are performing relative to their goals.
Formula: [(Ending Value of Portfolio - Beginning Value of Portfolio + Income from Investments) / Beginning Value of Portfolio] * 100
Calculation Example: If the portfolio starts at $1,000,000, ends at $1,100,000, and generates $10,000 in dividends, the portfolio return is [($1,100,000 - $1,000,000 + $10,000) / $1,000,000] * 100 = 11%.
Business Question: What is the risk-adjusted return of the portfolio compared to the risk-free rate?
Definition: The Sharpe ratio measures the performance of an investment portfolio relative to the risk-free rate, adjusted for the portfolio's risk.
Description: This metric helps investors understand whether the portfolio's excess returns are due to smart investment decisions or increased risk. A higher Sharpe ratio indicates better risk-adjusted returns.
Formula: (Portfolio Return - Risk-Free Rate) / Portfolio Standard Deviation
Calculation Example: If a portfolio has a return of 10%, the risk-free rate is 2%, and the portfolio's standard deviation is 8%, the Sharpe ratio is (10% - 2%) / 8% = 1.
Business Question: What is the degree of variation in the portfolio's returns over time?
Definition: Portfolio risk (volatility) represents the extent to which a portfolio's returns fluctuate, indicating the level of risk involved.
Description: Volatility is a measure of the risk an investor faces from fluctuations in the market. A highly volatile portfolio can offer higher returns but comes with higher risk.
Formula: Standard Deviation of Portfolio Returns
Calculation Example: If the portfolio's monthly returns vary with a standard deviation of 5%, the portfolio volatility is 5%.
Business Question: How is the investment portfolio distributed across different asset classes?
Definition: Asset allocation refers to the percentage distribution of a portfolio's investments among various asset classes, such as equities, bonds, and real estate.
Description: Proper asset allocation helps investors manage risk and return by diversifying investments across different asset categories, based on investment goals and risk tolerance.
Formula: (Value of Asset Class / Total Portfolio Value) * 100
Calculation Example: If a portfolio has $400,000 in equities, $300,000 in bonds, and $300,000 in real estate, the asset allocation for equities is ($400,000 / $1,000,000) * 100 = 40%.
Business Question: What percentage of the portfolio’s assets is being used for administrative and management expenses?
Definition: The expense ratio measures the cost of managing and operating an investment portfolio as a percentage of the total assets.
Description: The expense ratio gives investors a sense of how much they are paying for the management of their portfolio. A lower expense ratio is preferable as it means more of the portfolio's returns go to the investor.
Formula: (Total Fund Expenses / Total Assets Under Management) * 100
Calculation Example: If a portfolio has $1,000,000 in assets and incurs $15,000 in expenses, the expense ratio is ($15,000 / $1,000,000) * 100 = 1.5%.
Business Question: How much has the portfolio outperformed or underperformed the benchmark?
Definition: Alpha measures the excess return of a portfolio relative to the performance of a benchmark index.
Description: Alpha shows the value added (or lost) by the portfolio manager compared to a passive investment in the market. A positive alpha means the portfolio has outperformed its benchmark, while a negative alpha means it has underperformed.
Formula: Portfolio Return - Benchmark Return
Calculation Example: If the portfolio returns 12% and the benchmark returns 10%, the alpha is 12% - 10% = 2%.
Business Question: How sensitive is the portfolio to market movements?
Definition: Beta measures the volatility of a portfolio relative to the market, indicating how much the portfolio is expected to move in relation to market changes.
Description: A beta of 1 means the portfolio moves in line with the market. A beta greater than 1 indicates higher sensitivity to market movements, while a beta less than 1 indicates lower sensitivity.
Formula: Covariance of Portfolio Return and Market Return / Variance of Market Return
Calculation Example: If a portfolio has a beta of 1.2, it is expected to be 20% more volatile than the market.
Business Question: How much dividend income is the portfolio generating relative to its total value?
Definition: Dividend yield is the annual dividend income generated by the portfolio's assets, expressed as a percentage of the portfolio’s total value.
Description: This KPI helps investors understand the income-generating potential of their portfolio, particularly for income-focused strategies.
Formula: (Total Dividends Received / Portfolio Value) * 100
Calculation Example: If a portfolio receives $50,000 in dividends and has a total value of $1,000,000, the dividend yield is ($50,000 / $1,000,000) * 100 = 5%.
Business Question: What is the total gain or loss made on an investment relative to its initial cost?
Definition: ROI measures the percentage return earned on an investment, calculated as the gain (or loss) relative to the initial investment amount.
Description: ROI helps investors assess the profitability of an investment. A higher ROI indicates better investment performance.
Formula: [(Ending Value of Investment - Initial Investment) / Initial Investment] * 100
Calculation Example: If an investment grows from $100,000 to $150,000, the ROI is [($150,000 - $100,000) / $100,000] * 100 = 50%.
Business Question: How frequently are assets within the portfolio being bought and sold?
Definition: The turnover ratio measures the frequency with which the portfolio manager buys and sells securities within the portfolio over a specific period.
Description: A high turnover ratio indicates frequent trading, which may lead to higher transaction costs and tax implications, while a low turnover ratio suggests a more long-term, buy-and-hold strategy.
Formula: (Total Value of Securities Sold or Bought / Average Portfolio Value) * 100
Calculation Example: If a portfolio with an average value of $1,000,000 sees $400,000 in securities traded during the year, the turnover ratio is ($400,000 / $1,000,000) * 100 = 40%.

