Kpi's in Healthcare
Transform Operations, Enhance Productivity, and Drive Growth with Data-Driven Insights.
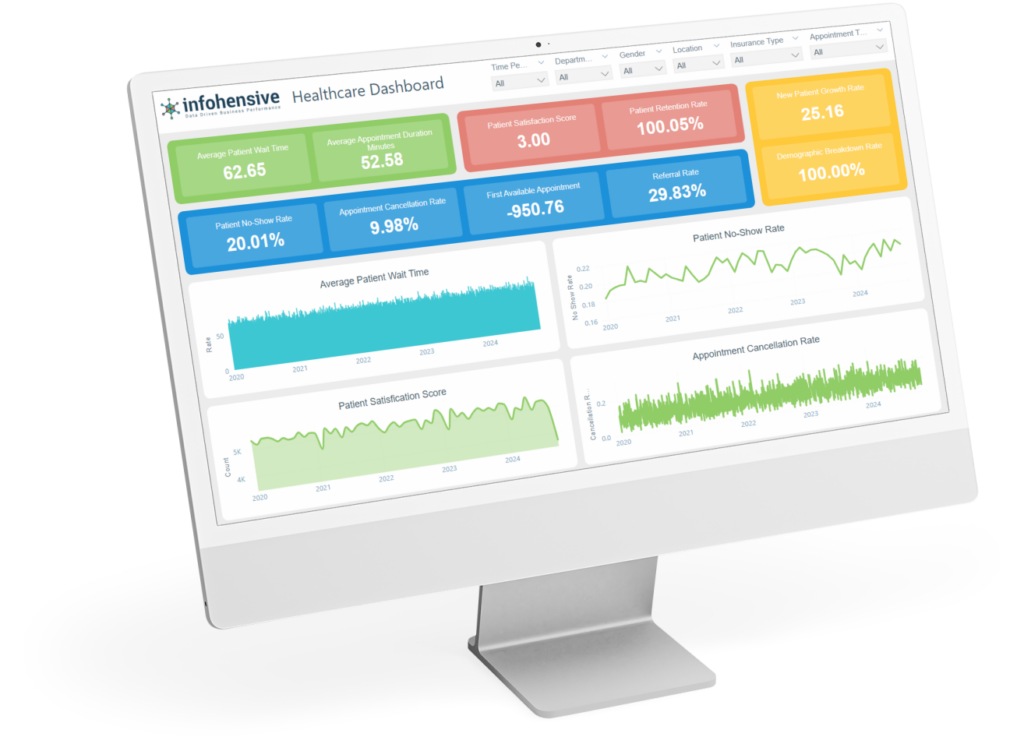
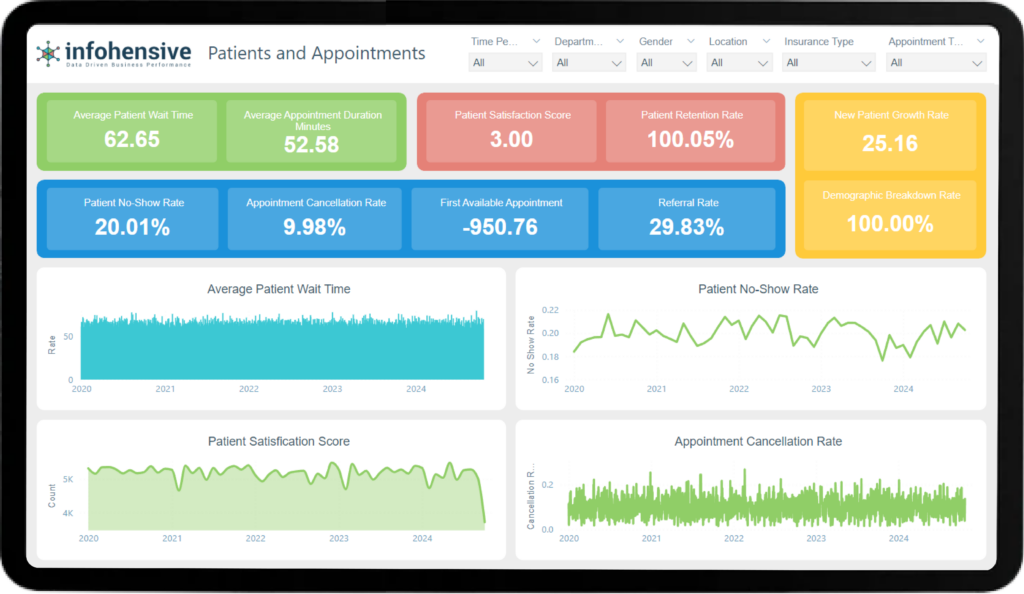
Business Question: How long do patients typically wait before seeing a healthcare provider?
Definition: Measures the average time a patient spends waiting from registration to receiving medical attention.
Full Paragraph Description: This KPI is crucial for understanding patient satisfaction and operational efficiency. Long wait times can indicate issues in scheduling, staffing, or resource allocation and can negatively impact patient experience. Monitoring this KPI helps identify bottlenecks and improve overall patient flow.
Formula: Average Patient Wait Time = Total Wait Time / Number of Patients
Calculation Example: If the total wait time for 100 patients in a day is 500 minutes, the average wait time is 500 / 100 = 5 minutes.
Chart Type: Line Chart
Color Tune: Soothing Blue
Business Question: What percentage of patients miss their scheduled appointments?
Definition: Measures the proportion of scheduled appointments that patients do not attend.
Full Paragraph Description: High no-show rates can lead to inefficiencies and lost revenue. Understanding and addressing the reasons for no-shows can help improve scheduling and patient communication. Implementing reminder systems and flexible scheduling options can reduce no-show rates and improve resource utilization.
Formula: No-Show Rate = (Number of No-Show Appointments / Total Scheduled Appointments) * 100
Calculation Example: If there are 20 no-shows out of 200 scheduled appointments, the no-show rate is (20 / 200) * 100 = 10%.
Chart Type: Bar Chart
Color Tune: Alert Red
Business Question: How satisfied are patients with their experience?
Definition: Measures patients' overall satisfaction with their visit to the healthcare facility.
Full Paragraph Description: High patient satisfaction scores indicate good quality of care and positive patient experiences, which can lead to better patient retention and positive word-of-mouth. This KPI can be measured through surveys and feedback forms, focusing on various aspects of the patient experience such as wait times, staff interaction, and overall care quality.
Formula: Patient Satisfaction Score = (Sum of All Patient Satisfaction Ratings / Total Number of Responses) * 100
Calculation Example: If the total satisfaction score from 100 responses is 450, the average satisfaction score is 450 / 100 = 4.5 out of 5.
Chart Type: Pie Chart
Color Tune: Positive Green
Business Question: What percentage of appointments are canceled by patients or the clinic?
Definition: Measures the proportion of scheduled appointments that are canceled.
Full Paragraph Description: Tracking cancellation rates helps identify patterns and reasons for cancellations, enabling the facility to improve scheduling practices and reduce disruptions. High cancellation rates can lead to resource wastage and inefficiencies, making it crucial to address underlying causes such as inconvenient appointment times or lack of patient engagement.
Formula: Cancellation Rate = (Number of Canceled Appointments / Total Scheduled Appointments) * 100
Calculation Example: If there are 15 cancellations out of 150 scheduled appointments, the cancellation rate is (15 / 150) * 100 = 10%.
Chart Type: Column Chart
Color Tune: Neutral Gray
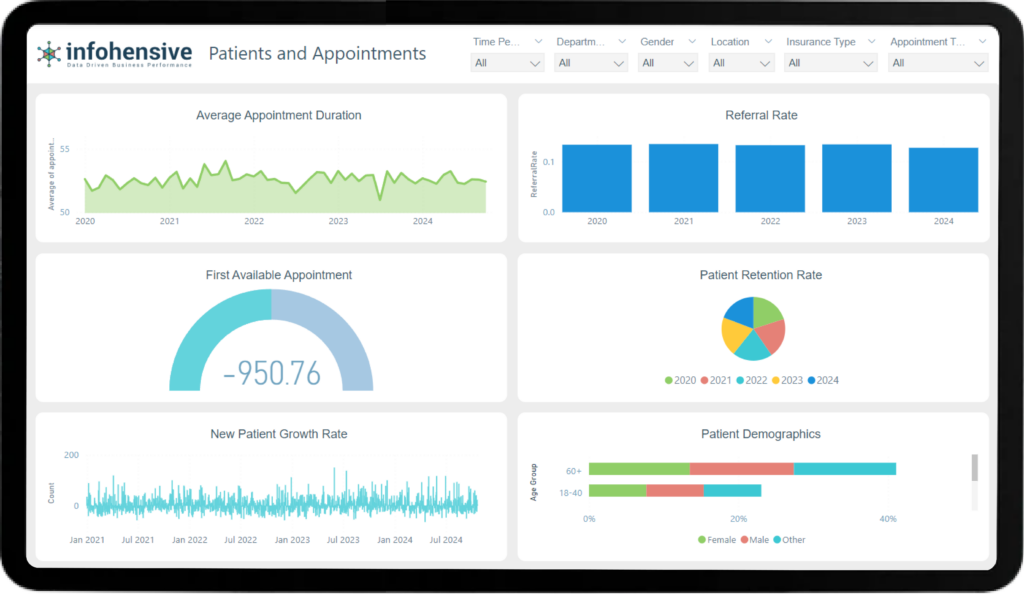
Business Question: How long do appointments typically last?
Definition: Measures the average time duration of patient appointments.
Full Paragraph Description: This KPI helps in understanding the efficiency of appointments and whether the time allocated is appropriate for different types of consultations. By monitoring this metric, healthcare facilities can optimize appointment schedules, improve patient flow, and ensure that sufficient time is given for quality patient care.
Formula: Average Appointment Duration = Total Time of All Appointments / Total Number of Appointments
Calculation Example: If the total time spent on 80 appointments is 4000 minutes, the average appointment duration is 4000 / 80 = 50 minutes.
Chart Type: Line Chart
Color Tune: Calming Purple
Business Question: How often are patients referred to other specialists or services?
Definition: Measures the percentage of patients who are referred to specialists or other healthcare services.
Full Paragraph Description: High referral rates can indicate the need for specialized care and help in understanding the network of care within the facility. This KPI helps track the efficiency and effectiveness of the referral process, ensuring that patients receive timely and appropriate care.
Formula: Referral Rate = (Number of Referrals / Total Number of Patients) * 100
Calculation Example: If there are 30 referrals out of 200 patient visits, the referral rate is (30 / 200) * 100 = 15%.
Chart Type: Bar Chart
Color Tune: Professional Blue
Business Question: How soon can new patients get an appointment?
Definition: Measures the average time a patient has to wait to get the first available appointment.
Full Paragraph Description: This KPI is essential for understanding access to care and scheduling efficiency. Shorter wait times for first appointments can improve patient satisfaction and access to care, indicating a well-managed scheduling system.
Formula: First Available Appointment = Total Days Until First Available Appointment / Number of Appointments
Calculation Example: If the first available appointments for 10 patients are in 3, 5, 7, 4, 6, 8, 2, 9, 5, and 4 days, the average wait time is (3+5+7+4+6+8+2+9+5+4) / 10 = 5.3 days.
Chart Type: Line Chart
Color Tune: Optimistic Yellow
Business Question: What percentage of patients return for follow-up appointments?
Definition: Measures the proportion of patients who return to the healthcare facility for follow-up care.
Full Paragraph Description: High retention rates indicate patient loyalty and satisfaction with the care received. It also reflects the facility's ability to build long-term relationships with patients, which is crucial for continuous care and business sustainability.
Formula: Retention Rate = (Number of Returning Patients / Total Number of Patients) * 100
Calculation Example: If 80 out of 100 patients return for follow-up appointments, the retention rate is (80 / 100) * 100 = 80%.
Chart Type: Pie Chart
Color Tune: Trustworthy Green
Business Question: How is the number of new patients changing over time?
Definition: Measures the rate at which new patients are joining the healthcare facility.
Full Paragraph Description: This KPI helps in understanding the growth and outreach of the healthcare facility. A higher growth rate indicates successful marketing and a good reputation, contributing to the overall expansion and sustainability of the healthcare practice.
Formula: New Patient Growth Rate = ((Number of New Patients in Current Period - Number of New Patients in Previous Period) / Number of New Patients in Previous Period) * 100
Calculation Example: If there were 120 new patients this month compared to 100 last month, the growth rate is ((120 - 100) / 100) * 100 = 20%.
Chart Type: Column Chart
Color Tune: Vibrant Orange
Business Question: What is the demographic breakdown of patients visiting the facility?
Definition: Measures the distribution of patients by age, gender, and other relevant demographic factors.
Full Paragraph Description: Understanding patient demographics helps tailor services and communication strategies to meet the specific needs of different patient groups. This KPI provides insights into the diversity of the patient population, helping to improve targeted care and outreach programs.
Formula: Demographic Breakdown = Number of Patients in Demographic Group / Total Number of Patients
Calculation Example: If there are 300 patients and 90 of them are aged 60 and above, the percentage of patients aged 60+ is (90 / 300) * 100 = 30%.
Chart Type: Pie Chart
Color Tune: Inclusive Multicolor Palette
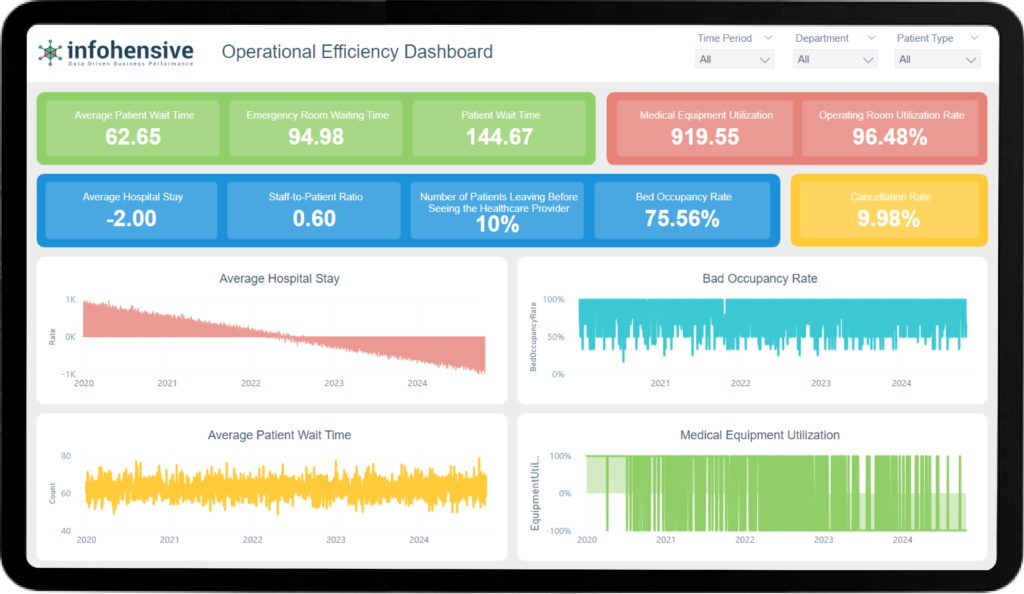
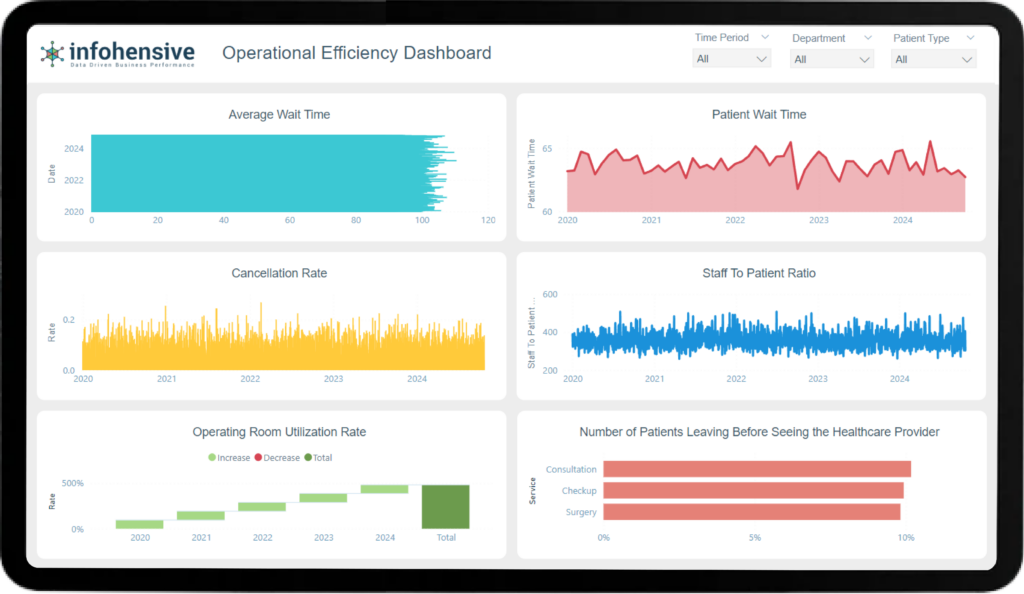
Business Question: What is the average duration of stay for patients at the healthcare facility?
Definition: Measures the average time spent by a patient in the hospital.
Description: Average Hospital Stay is a crucial metric for understanding patient turnover and bed availability. It reflects the efficiency of patient care processes and resource utilization. A lower average stay can indicate efficient treatment and discharge processes, while a higher average may suggest complexity in cases or potential inefficiencies.
Formula: Total Stay Duration / Total Number of Stays
Calculation Example: If the total stay duration for 100 patients is 500 days, the average hospital stay is 500 / 100 = 5 days.
Type of Chart: Line Chart
Attractive Colour Tune: Shades of Blue and White
Business Question: What percentage of hospital beds are occupied at any given time?
Definition: The percentage of hospital beds that are occupied.
Description: Bed Occupancy Rate indicates how well a hospital is managing its bed capacity. High occupancy rates can stress resources and staff, while low rates may indicate underutilization of facilities. Monitoring this metric helps balance patient care needs with resource availability.
Formula: (Number of Beds Occupied / Total Number of Beds) * 100
Calculation Example: If there are 200 beds and 150 are occupied, the bed occupancy rate is (150 / 200) * 100 = 75%.
Type of Chart: Bar Chart
Attractive Colour Tune: Shades of Green and White
Business Question: How long do patients wait on average before receiving treatment?
Definition: The average time patients wait before being seen by a healthcare provider.
Description: Average Patient Wait Time is directly linked to patient satisfaction and operational efficiency. Long wait times can lead to patient dissatisfaction and reflect poorly on the facility's efficiency. By analyzing this metric, hospitals can identify peak times and optimize staffing and scheduling.
Formula: Total Wait Time / Number of Patients
Calculation Example: If the total wait time for 200 patients is 1000 minutes, the average wait time is 1000 / 200 = 5 minutes.
Type of Chart: Pie Chart
Attractive Colour Tune: Shades of Orange and Yellow
Business Question: How effectively is medical equipment being used?
Definition: Measures the usage rate of medical equipment.
Description: Medical Equipment Utilization tracks how often and effectively medical devices are used. High utilization indicates good asset management and minimal waste, while low utilization could point to unnecessary expenses or inefficient practices. This metric helps in making informed decisions about equipment purchases and maintenance.
Formula: (Time Equipment in Use / Total Available Time) * 100
Calculation Example: If the equipment is in use for 400 hours out of 500 available hours, the utilization rate is (400 / 500) * 100 = 80%.
Type of Chart: Column Chart
Attractive Colour Tune: Shades of Red and Gray
Business Question: How long does it take for patients to receive initial care in the emergency room?
Definition: Average wait time in the emergency room.
Description: Emergency Room Waiting Time measures the efficiency of emergency services. It reflects the hospital's ability to handle urgent cases promptly. Reducing this time is critical for patient outcomes and satisfaction, particularly during peak periods or crises.
Formula: Total ER Wait Time / Number of ER Patients
Calculation Example: If the total ER wait time for 100 patients is 600 minutes, the average ER wait time is 600 / 100 = 6 minutes.
Type of Chart: Donut Chart
Attractive Colour Tune: Shades of Purple and White
Business Question: How many patients leave before being seen by a healthcare provider?
Definition: The number of patients who leave the facility before their visit.
Description: This KPI indicates issues in patient wait times and satisfaction. A high number of patients leaving before being seen suggests that wait times or communication issues need to be addressed. Improving this metric can enhance patient retention and satisfaction.
Formula: Total Number of Patients Leaving / Total Number of Patients * 100
Calculation Example: If 20 out of 500 patients leave before being seen, the rate is (20 / 500) * 100 = 4%.
Type of Chart: Stacked Bar Chart
Attractive Colour Tune: Shades of Teal and White
Business Question: What percentage of appointments are canceled?
Definition: The percentage of canceled appointments.
Description: The Cancellation Rate measures how often patients cancel their appointments. High cancellation rates can indicate issues with scheduling, patient satisfaction, or communication. Reducing cancellations helps improve resource utilization and patient care continuity.
Formula: (Number of Cancellations / Total Appointments) * 100
Calculation Example: If there are 50 cancellations out of 1000 appointments, the cancellation rate is (50 / 1000) * 100 = 5%.
Type of Chart: Area Chart
Attractive Colour Tune: Shades of Yellow and Black
Business Question: How many medical staff are available per patient?
Definition: The ratio of medical staff to patients.
Description: Staff-to-Patient Ratio is crucial for maintaining high standards of care and ensuring patient safety. A low ratio can lead to burnout and reduced care quality, while a high ratio indicates adequate staffing levels. This metric helps in workforce planning and ensuring optimal patient care.
Formula: Total Number of Staff / Total Number of Patients
Calculation Example: If there are 100 staff members for 400 patients, the ratio is 100 / 400 = 0.25.
Type of Chart: Radar Chart
Attractive Colour Tune: Shades of Blue and Gray
Business Question: How effectively are the operating rooms being used?
Definition: The percentage of time operating rooms are utilized.
Description: Operating Room Utilization measures the efficiency of surgical services. High utilization rates indicate effective scheduling and resource use, while low rates may suggest inefficiencies. Optimizing this metric ensures better availability of surgical care and maximizes productivity.
Formula: (Time Operating Room in Use / Total Available Time) * 100
Calculation Example: If the OR is used for 300 hours out of 400 available hours, the utilization rate is (300 / 400) * 100 = 75%.
Type of Chart: Waterfall Chart
Attractive Colour Tune: Shades of Pink and White
Business Question: How long do patients wait before their scheduled procedure or appointment?
Definition: The duration of a patient’s wait before their scheduled procedure, test, or appointment.
Description: Patient Wait Time is a key metric for patient satisfaction and operational efficiency. Shorter wait times improve patient experiences and can enhance the overall efficiency of the healthcare facility. Monitoring and optimizing this metric helps in better scheduling and resource allocation.
Formula: Total Wait Time / Number of Patients
Calculation Example: If the total wait time for 300 patients is 900 minutes, the average wait time is 900 / 300 = 3 minutes.
Type of Chart: Scatter Plot
Attractive Colour Tune: Shades of Orange and Gray
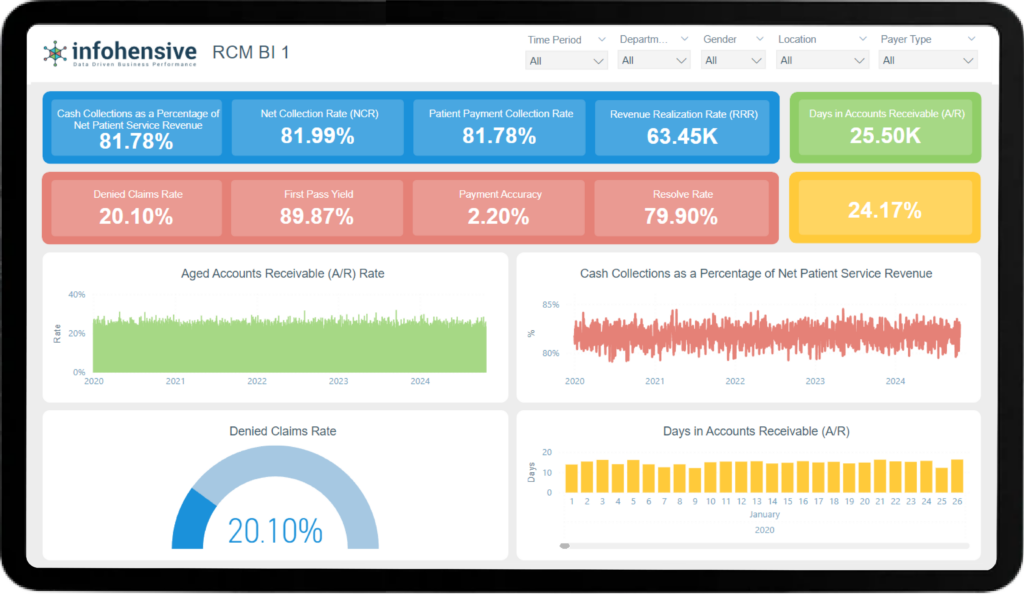
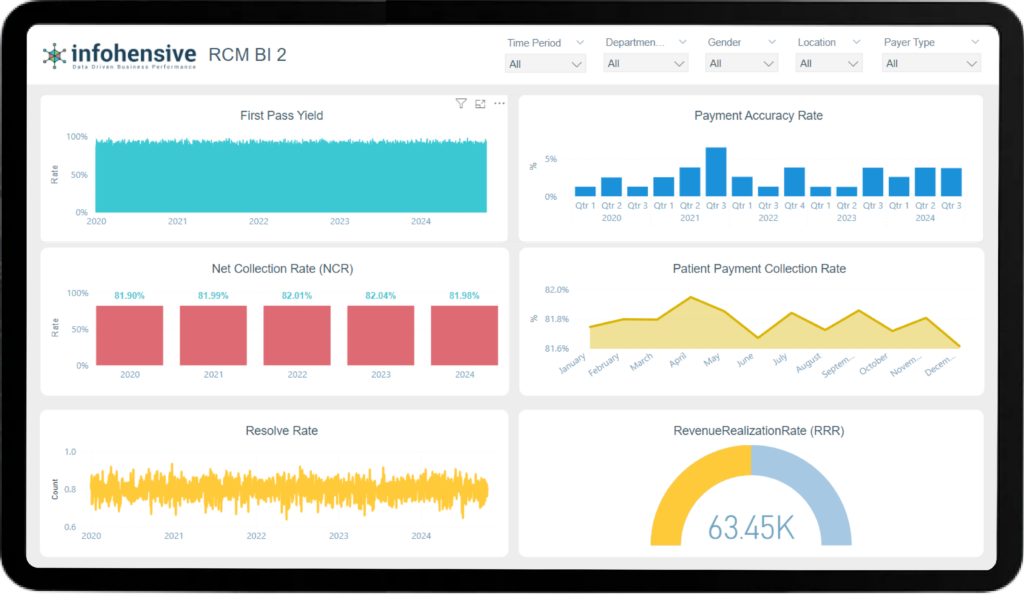
Business Question: What percentage of accounts receivable are overdue?
Definition: Percentage of A/R over 90 days or 120 days.
Description: The Aged Accounts Receivable (A/R) Rate measures the proportion of outstanding receivables that have been overdue for more than 90 or 120 days. This KPI helps in understanding the efficiency of the billing and collection process. A high aged A/R rate may indicate issues with patient payments or inefficiencies in the billing process, which can negatively impact cash flow.
Formula: (Total A/R over 90 days / Total A/R) * 100
Calculation Example: If the total A/R is $500,000 and $150,000 is over 90 days, the aged A/R rate is (150,000 / 500,000) * 100 = 30%.
Type of Chart: Bar Chart
Attractive Colour Tune: Shades of Blue and Orange
Business Question: How effective is the practice in collecting payments for services rendered?
Definition: Efficiency of collecting payments for services provided.
Description: This KPI measures the efficiency of a healthcare organization in collecting payments for the services it provides. It is crucial for ensuring a steady cash flow. A high percentage indicates effective collection processes and financial health.
Formula: (Total Patient Service Cash Collected / Net Patient Service Revenue) * 100
Calculation Example: If the net patient service revenue is $1,000,000 and the cash collected is $950,000, the percentage is (950,000 / 1,000,000) * 100 = 95%.
Type of Chart: Line Chart
Attractive Colour Tune: Shades of Green and White
Business Question: How long does it take on average to receive payment for services rendered?
Definition: Average number of days to receive payment for a claim.
Description: Days in A/R is a critical KPI that indicates the average time it takes to collect payments owed to the practice. Shorter days in A/R signify efficient billing and collection processes, contributing to better cash flow and financial stability.
Formula: (Total A/R / Average Daily Charges)
Calculation Example: If the total A/R is $300,000 and the average daily charges are $10,000, the days in A/R is 300,000 / 10,000 = 30 days.
Type of Chart: Pie Chart
Attractive Colour Tune: Shades of Red and Gray
Business Question: What percentage of claims submitted are denied by payers?
Definition: Percentage of claims denied by payers.
Description: The Denied Claims Rate measures the proportion of submitted claims that are rejected by payers. A high denial rate can indicate issues with claim submissions, such as errors in coding or patient eligibility. Reducing the denial rate can improve revenue and operational efficiency.
Formula: (Total Denied Claims / Total Submitted Claims) * 100
Calculation Example: If 100 claims are submitted and 10 are denied, the denied claims rate is (10 / 100) * 100 = 10%.
Type of Chart: Donut Chart
Attractive Colour Tune: Shades of Yellow and Black
Business Question: What percentage of claims are paid correctly on the first submission?
Definition: Percentage of claims paid correctly on the first submission.
Description: First Pass Yield measures the efficiency of the claims submission process. A higher percentage indicates that most claims are correctly processed and paid on the first attempt, reducing the need for rework and improving cash flow.
Formula: (Number of Claims Paid on First Submission / Total Claims Submitted) * 100
Calculation Example: If 500 claims are submitted and 475 are paid on the first submission, the first pass yield is (475 / 500) * 100 = 95%.
Type of Chart: Area Chart
Attractive Colour Tune: Shades of Purple and White
Business Question: What percentage of payments owed are actually collected?
Definition: Percentage of payments received out of what is contractually owed.
Description: The Net Collection Rate reflects the effectiveness of a healthcare organization in collecting all owed payments. It is a comprehensive measure that accounts for contractual adjustments, providing a true picture of collection efficiency.
Formula: (Cash Collected / (Charges - Contractual Adjustments)) * 100
Calculation Example: If the charges are $1,000,000, contractual adjustments are $100,000, and cash collected is $855,000, the NCR is (855,000 / (1,000,000 - 100,000)) * 100 = 95%.
Type of Chart: Column Chart
Attractive Colour Tune: Shades of Teal and White
Business Question: Are payments being made accurately according to the services provided?
Definition: Accuracy of payments for services provided.
Description: Payment Accuracy is a measure of whether the payments received are correct and match the services rendered. High payment accuracy indicates efficient billing processes and reduces the need for rework due to payment discrepancies.
Formula: (Number of Claims Paid Correctly / Number of Claims) * 100
Calculation Example: If 1,000 claims are submitted and 950 are paid correctly, the payment accuracy is (950 / 1,000) * 100 = 95%.
Type of Chart: Bubble Chart
Attractive Colour Tune: Shades of Orange and White
Business Question: What percentage of out-of-pocket patient charges are collected?
Definition: Percentage of out-of-pocket patient charges collected.
Description: This KPI measures the efficiency of collecting payments directly from patients. With increasing patient responsibility due to high deductibles and copays, this metric is crucial for maintaining cash flow and financial health.
Formula: (Total Patient Collection / Total Patient Charges) * 100
Calculation Example: If the total patient charges are $200,000 and the collection is $110,000, the patient payment collection rate is (110,000 / 200,000) * 100 = 55%.
Type of Chart: Stacked Bar Chart
Attractive Colour Tune: Shades of Green and Yellow
Business Question: How effective is the overall RCM process including eligibility, coding, and billing?
Definition: Efficacy of the RCM process including eligibility, coding, and billing.
Description: Resolve Rate indicates the effectiveness of the RCM process by showing the percentage of claims resolved (paid or settled) within a specific period. A high resolve rate suggests efficient RCM processes, leading to improved cash flow and reduced accounts receivable.
Formula: (Total Claims Paid / Total Claims) * 100
Calculation Example: If 800 out of 850 claims are paid, the resolve rate is (800 / 850) * 100 = 94.1%.
Type of Chart: Radar Chart
Attractive Colour Tune: Shades of Blue and Gray
Business Question: What percentage of charges are adjusted or collected?
Definition: Percentage of charges adjusted or collected.
Description: Revenue Realization Rate measures the effectiveness of converting charges into actual revenue. This KPI considers both payments received and adjustments made, providing a comprehensive view of the practice’s financial performance.
Formula: (Sum of Payments + Adjustments) / Total Charges * 100
Calculation Example: If the total charges are $1,000,000, payments are $850,000, and adjustments are $50,000, the RRR is ((850,000 + 50,000) / 1,000,000) * 100 = 90%.
Type of Chart: Waterfall Chart
Attractive Colour Tune: Shades of Pink and White
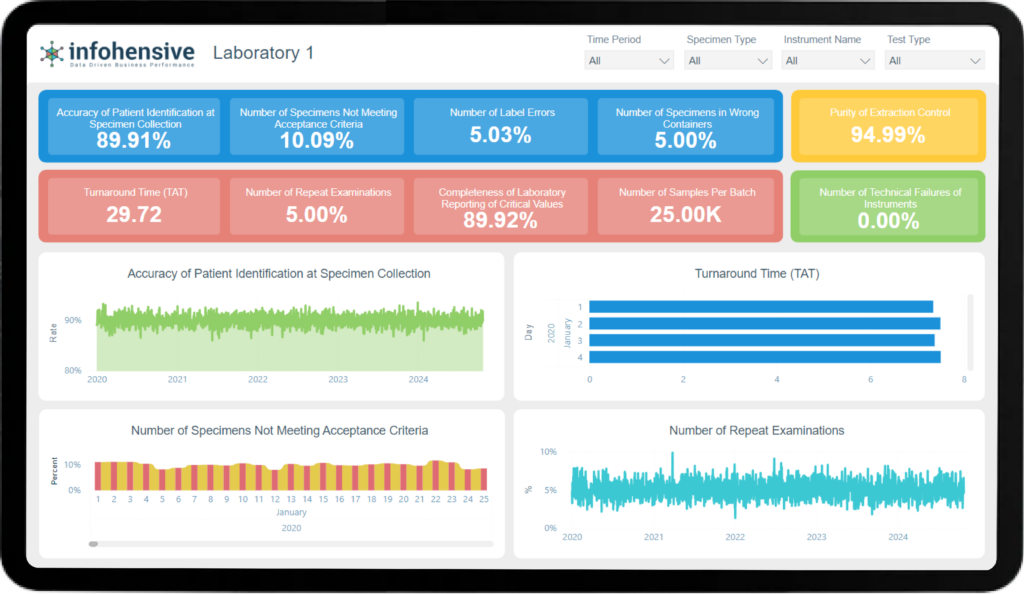
Business Question: How accurately are patients identified during specimen collection?
Definition: Measures the percentage of specimens correctly matched to the corresponding patient at the time of collection.
Full Paragraph Description: Ensuring the accuracy of patient identification at the time of specimen collection is crucial for maintaining the integrity of test results and patient safety. Misidentification can lead to incorrect diagnoses and treatments. This KPI tracks the accuracy of patient identification processes and helps identify areas needing improvement.
Formula: Accuracy Rate = (Number of Correctly Identified Specimens / Total Number of Specimens Collected) * 100
Calculation Example: If 950 out of 1,000 specimens are correctly identified, the accuracy rate is (950 / 1,000) * 100 = 95%.
Chart Type: Bar Chart
Color Tune: Trustworthy Green
Business Question: How long does it take to complete tests from specimen collection to reporting results?
Definition: Measures the average time taken from when a specimen is collected to when the test results are reported.
Full Paragraph Description: Turnaround Time (TAT) is a critical KPI that impacts patient care and satisfaction. It reflects the efficiency of laboratory operations and the timeliness of delivering test results to healthcare providers. Monitoring TAT helps identify bottlenecks and optimize workflow processes to ensure timely reporting of results.
Formula: Average TAT = Total Time for All Tests / Total Number of Tests
Calculation Example: If the total time for 500 tests is 2,500 hours, the average TAT is 2,500 / 500 = 5 hours.
Chart Type: Line Chart
Color Tune: Dynamic Blue
Business Question: How many specimens fail to meet the laboratory’s acceptance criteria, and why?
Definition: Tracks the number and reasons why specimens do not meet the laboratory's acceptance criteria.
Full Paragraph Description: This KPI helps identify issues in specimen collection and handling processes. High numbers of rejected specimens can indicate training gaps, procedural flaws, or communication issues with specimen sources. Understanding the reasons for non-acceptance enables targeted interventions to improve the quality of specimens received.
Formula: Number of Non-Accepted Specimens = Total Number of Non-Accepted Specimens / Total Number of Specimens
Calculation Example: If 30 out of 1,200 specimens do not meet acceptance criteria, the non-acceptance rate is 30 / 1,200 = 2.5%.
Chart Type: Column Chart
Color Tune: Alert Red
Business Question: How many tests need to be repeated, and why?
Definition: Measures the number and reasons for repeat examinations.
Full Paragraph Description: High numbers of repeat examinations can indicate issues with initial test accuracy, equipment malfunctions, or specimen quality. Tracking this KPI helps identify root causes and implement corrective actions to improve first-time test accuracy and reduce operational inefficiencies.
Formula: Repeat Examination Rate = (Number of Repeat Examinations / Total Number of Examinations) * 100
Calculation Example: If there are 50 repeat examinations out of 1,000 total examinations, the repeat rate is (50 / 1,000) * 100 = 5%.
Chart Type: Bar Chart
Color Tune: Neutral Gray
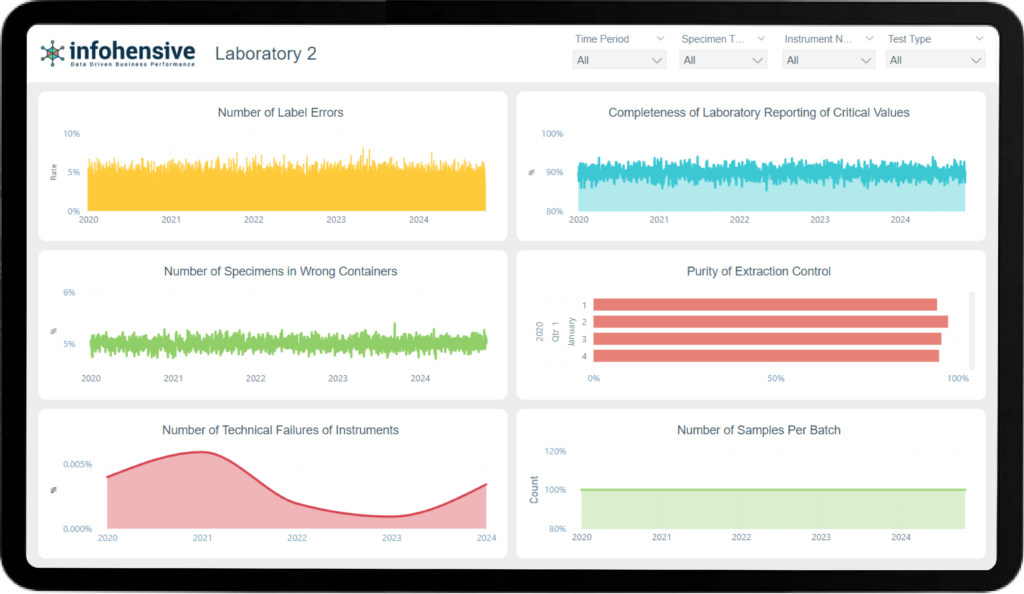
Business Question: How frequently do labeling errors occur?
Definition: Measures the number of labeling errors in specimens received by the laboratory.
Full Paragraph Description: Labeling errors can lead to significant issues, including misidentification of specimens and incorrect test results. Monitoring this KPI helps identify the frequency and potential causes of labeling errors, enabling the implementation of corrective measures to ensure accurate specimen labeling.
Formula: Label Error Rate = (Number of Label Errors / Total Number of Specimens) * 100
Calculation Example: If 10 labeling errors are found in 800 specimens, the error rate is (10 / 800) * 100 = 1.25%.
Chart Type: Pie Chart
Color Tune: Warning Yellow
Business Question: How complete and timely are the laboratory reports of critical values?
Definition: Measures the completeness and timeliness of reporting critical values to the appropriate healthcare providers.
Full Paragraph Description: Reporting critical values promptly is essential for timely clinical decision-making and patient care. This KPI tracks how effectively and efficiently critical values are communicated, helping to ensure that urgent medical conditions are addressed without delay.
Formula: Completeness Rate = (Number of Complete Critical Value Reports / Total Number of Critical Value Reports) * 100
Calculation Example: If 48 out of 50 critical value reports are complete and timely, the completeness rate is (48 / 50) * 100 = 96%.
Chart Type: Column Chart
Color Tune: Reliable Blue
Business Question: How often are specimens received in incorrect containers?
Definition: Tracks the number of specimens that are placed in incorrect containers.
Full Paragraph Description: Correct container usage is crucial for specimen integrity and test accuracy. This KPI identifies how often specimens are received in incorrect containers, which can lead to test delays or inaccuracies. Addressing this issue involves proper training and communication with specimen collection personnel.
Formula: Wrong Container Rate = (Number of Specimens in Wrong Containers / Total Number of Specimens) * 100
Calculation Example: If 5 specimens are found in wrong containers out of 1,000, the rate is (5 / 1,000) * 100 = 0.5%.
Chart Type: Pie Chart
Color Tune: Critical Red
Business Question: How pure are the samples after extraction control?
Definition: Measures the purity levels of samples after the extraction process.
Full Paragraph Description: Ensuring high purity of samples post-extraction is essential for accurate test results. This KPI helps monitor the effectiveness of the extraction process, ensuring that samples are free from contaminants that could interfere with test outcomes.
Formula: Purity Rate = (Number of Pure Extractions / Total Number of Extractions) * 100
Calculation Example: If 290 out of 300 extractions are pure, the purity rate is (290 / 300) * 100 = 96.67%.
Chart Type: Line Chart
Color Tune: Clean White
Business Question: How often do technical failures occur in laboratory instruments?
Definition: Measures the frequency and reasons for technical failures in laboratory instruments.
Full Paragraph Description: Technical failures can disrupt laboratory operations and delay test results. This KPI tracks the reliability of laboratory instruments, helping to identify frequently failing equipment and underlying issues. Timely maintenance and updates can reduce failures and improve overall efficiency.
Formula: Failure Rate = (Number of Technical Failures / Total Number of Instrument Uses) * 100
Calculation Example: If there are 3 technical failures out of 1,000 instrument uses, the failure rate is (3 / 1,000) * 100 = 0.3%.
Chart Type: Bar Chart
Color Tune: Maintenance Blue
Business Question: How many samples are processed in each batch?
Definition: Measures the average number of samples processed in each batch or run.
Full Paragraph Description: This KPI helps optimize batch processing and resource allocation. By understanding the number of samples processed per batch, laboratories can manage workload, improve efficiency, and ensure consistent quality of results. Tracking this metric also aids in planning for peak times and resource needs.
Formula: Average Samples Per Batch = Total Number of Samples / Total Number of Batches
Calculation Example: If 2,000 samples are processed in 100 batches, the average number of samples per batch is 2,000 / 100 = 20.
Chart Type: Line Chart
Color Tune: Efficient Green

